分析选项卡
“分析过程”涉及:
结果点地形高度
- 每个测风塔位置
- 每个风机位置
- 每个结果点位置
- 定义绘图区域网格的每一点
- 对于定义结果可视化网格的每个点
- 对于定义与每个中尺度实体相关联的表面的每个点
地形复杂度评估
- RIX评估了每个测风塔位置
- RIX评估了每个风机位置
坡度图的生成
- 在结果的可视化网格上
注解
这一过程的最后两个部分很繁重,但不是强制性的。
当选择“不需要rix分析”参数集时,这些过程将不会运行。
The process duration is proportional to : The number of entites and related sub-entities, the amount of orography data, and the process parameters).
进程选项

一旦风数据文件与项目相关联,就可以选择它作为要运行的分析过程的输入。
考虑到主要风区的影响,这里的风数据基本上有助于确定复杂地区的轮廓。如果分析是在没有风数据文件的情况下进行的,则将使用标准rix绘制轮廓,因为标准rix包含的站点信息较少。

定义运行类型。 对于本地类型,定义用于CFD模拟的处理器数量。 Nproc 0将自动考虑最大可用资源(=总CPU数 - 1)。
输入参数

通过选中参数文件读取输入载入过程所需数据。列表中客户默认的参数会被自动选择。

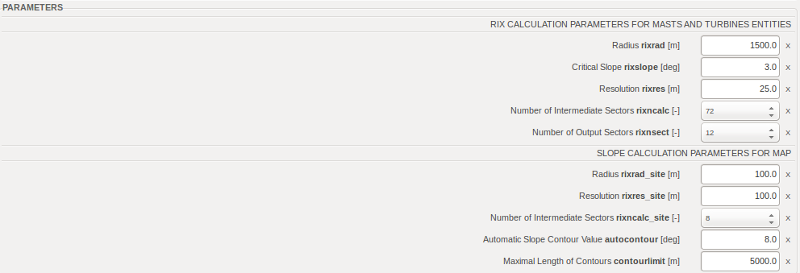
These parameters are only used when RIX calculations are activated.
RIX analysis is based on your project orography file, and provides results at each key locations and for each directional sector. The value, given in %, represents the part of the terrain around the wind turbine or met mast where the slope is higher than the critical slope.
The overall RIX value is the average of the sector-wise RIX values. For climato-based RIX, or WRIX, different weights are attributed to the sectors, with higher weights for prevailing directions.
注解
工程太大?尝试使用“fastZS”配置或更轻便的配置。
可视化
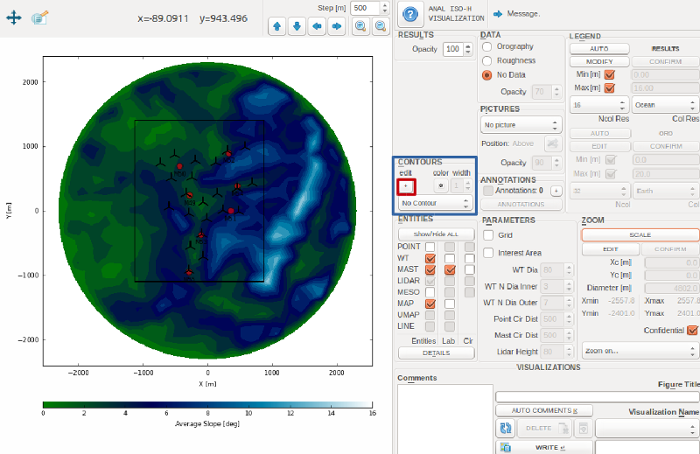
In this tab, the map visualization window features a specific module: The Slope Contour window.

Use the “+” button from the “CONTOURS” frame to generate slope contours.These contours can then be used by the mesher to generate RIX-dependent meshes.
- 拖动栏以选择斜率标准。
- 使用SHOW按钮在曲线上查看相应的轮廓。
- 使用ADD按钮保存轮廓。
Click on the RIX button to generate a bar graph showing the RIX and WRIX for each wind turbine and met mast.
技术说明
ZIX
ZIX 指标是什么?
ZIX是描述场址总复杂度的指标, 基于:
- 最大海拔高差 (
 )
) - 海拔标准偏差 (
 )
) - 平均坡度 (
 )
) - 最大坡度 (
 )
)
这些变量被评级为0-3, 3表示最复杂:
| 变量/评级 | 0 | 1 | 2 | 3 |
|---|---|---|---|---|
 [m] [m] |
[0,400[ | [400,850[ | [850,1300[ | [1300,  [ [ |
 [m] [m] |
[0,75[ | [75,175[ | [175,275[ | [275,  [ [ |
 [°] [°] |
[0,2[ | [2,5[ | [5,10[ | [10,  [ [ |
 [°] [°] |
[0,15[ | [15,21[ | [21,27[ | [27,  [ [ |
ZIX值将取上述四个评级中的最大值
RIX
什么是 RIX网格,它可以做什么?
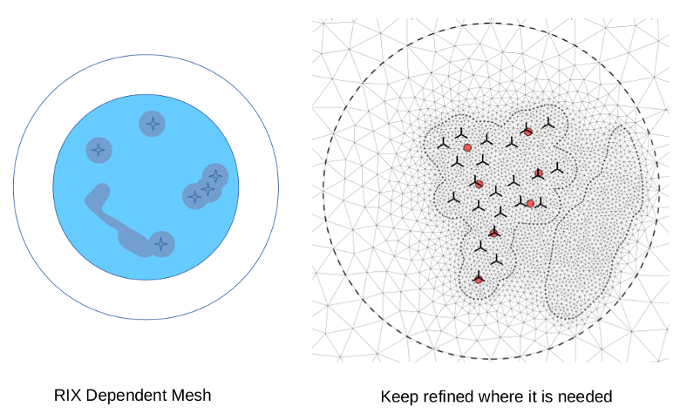
“RIX网格”这个特性可以用定义的康托线作为额外的网格建立参数而不仅仅是加密“兴趣区域”。

As long as the RIX analysis is activated, ZephyCFD will automatically generate a contour for extra interest area. With extra refinement on areas with more terrain complexity, the final result is more accurate.

除了RIX分析之外,ZephyCFD还能够运行粗糙度分析吗?
目前还没有,但基于气候学的RIX分析在网格建设中被认为更相关。


