ROSE Tab
The ROSE process allows:
- Combining selected CFD directional results
- Normalizing these results
- Generating wind rose for the selected result point in 1 degree sectors referring to the selected wind data and result points
The ROSE results will be used as the inputs for the EXTRAPOLATE process.
CFD directional results
In the Configuration frame on the left, CFD results to be used as rosing reference need to be checked.
If the CFD results are from different meshes, the AUTOMATIC button helps fill as many sectors as there are in the list without duplications. If there are multiple directional results for one sector the AUTOMATIC button will choose one of them, so the users still need to confirm whether or not it is the right one.
Process options

Reference entity for wind speed and direction
If the reference entity is not the same for speed and direction, it is possible to specify two different ones by unticking the checkbox above the chain symbol: A common situation is to have different measurement heights of anemometry and vane at the same location.

Mapping and visualization features
- Checking Map option allows exporting WRG files for the mapping areas instead of points, meanwhile users are allowed to use ISO-H on the mapping area in the EXTRAPOLATION step. Without checking it, you will still be able to EXRAPOLATE.
- Checking Visu option allows visualising ISO-Height of the entire projected area in EXRAPOLATE process.
Note
Checking any of these options will increase the process duration.
Visualizations
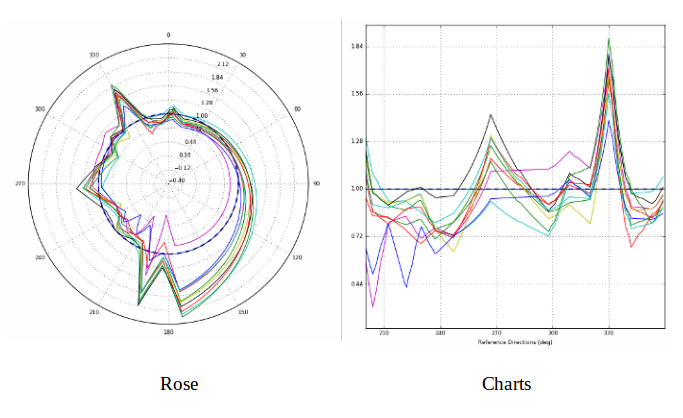
The ROSE Tab features Roses visualizations:

The ROSE visualization button allows to generate roses of directional CFD results at selected points.
The available output variables are:
- Horizontal Speed-up factor
- Turbulence Intensity Variation
- Horizontal Direction Variation
- Flow Inclination
- Turbulence Intensity
There are two available styles for the plots:
- Rose allows an overview of all directional results.
- Chart allows zooming in to the most concerned sectors.

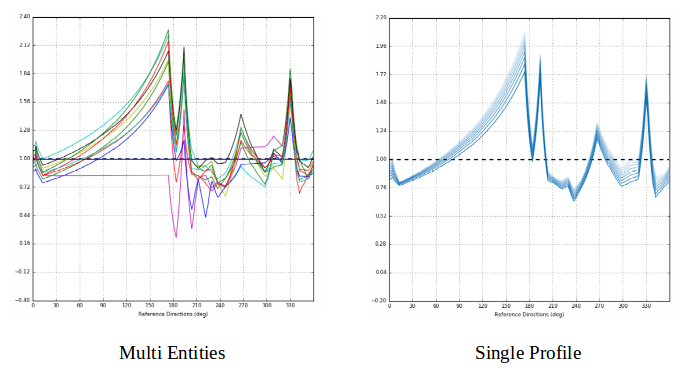
There are two available types for the plots:
- Multi Entities plots variables of different entities at a given height.
- Single Profile allows plotting results from one entity at different heights(difined in PLOT TYPE frame)


