ZephyWDP
The ZephyWDP software is developed by Zephy-Science for fast and intuitive wind data analysis and processing.
ZephyWDP数据显示
工作流程
ZephyWDP界面由风数据处理项目中的逻辑步骤构成:
- 它被分成几个选项卡,每个选项卡对应于该过程中的不同步骤。
- 用户将从左到右浏览这些标签。
- 用户可以在选项卡的上方和下方访问每个步骤通用的一些选项和操作

The intended workflow is to gather all your different onsite data sets into one single project, as ZephyWDP supports sorting and structuring the data by measurement locations (cf. Locations). This structure then allows to analyze all the available measurements against each other, as well as to perform some gap filling and extrapolation.
关于常见按钮和操作:

|
访问此文档 |
|
Access the 列队管理 window |

|
从您的收藏中添加/删除项目 |

|
保存项目 |
警告
与在每次操作后保存项目的 ZephyCFD 不同, ZephyWDP 中需要手动保存项目。这是为了避免在工作过程中卡住, 因为 ZephyWDP 在每次保存时可能需要往硬盘里写入大量数据。
记住要频繁地保存!
注解
某些选项卡呈灰色,因为这些功能还尚未实现,但它们会出现在未来的版本中。
所有过滤条件
“列出筛选器” 给予选项来定义需要在树状图或组合框中展示哪些筛选条件, 这些筛选器能被有效应用于 ZephyWDP 所有步骤.
|
仅显示选中位置时间序列. |
|
仅显示风速/风向 |
注解
当一组筛选器被确定, 一些筛选条件将在树状图中隐藏, 但他们仍将出现在图中, 基于他们的选择条件仍然有效.
数据筛选器
窗口下方的”数据筛选器”可以设置筛选时间序列的条件, 这些条件将能应用于ZephyWDP 中的所有步骤, 包含数据导出.
|
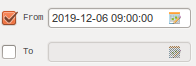
使用开始日期和/或结束日期过滤所有序列。 点击条目右侧的图标以访问日历小插件。 |
|
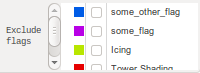
过滤所有序列, 以排除具有给定标志的数据。 |
注解
定义过滤时, ZephyWDP 就像删除了相应的数据, 同时仍然可以通过简单地停用过滤器来恢复它。
属性选项卡
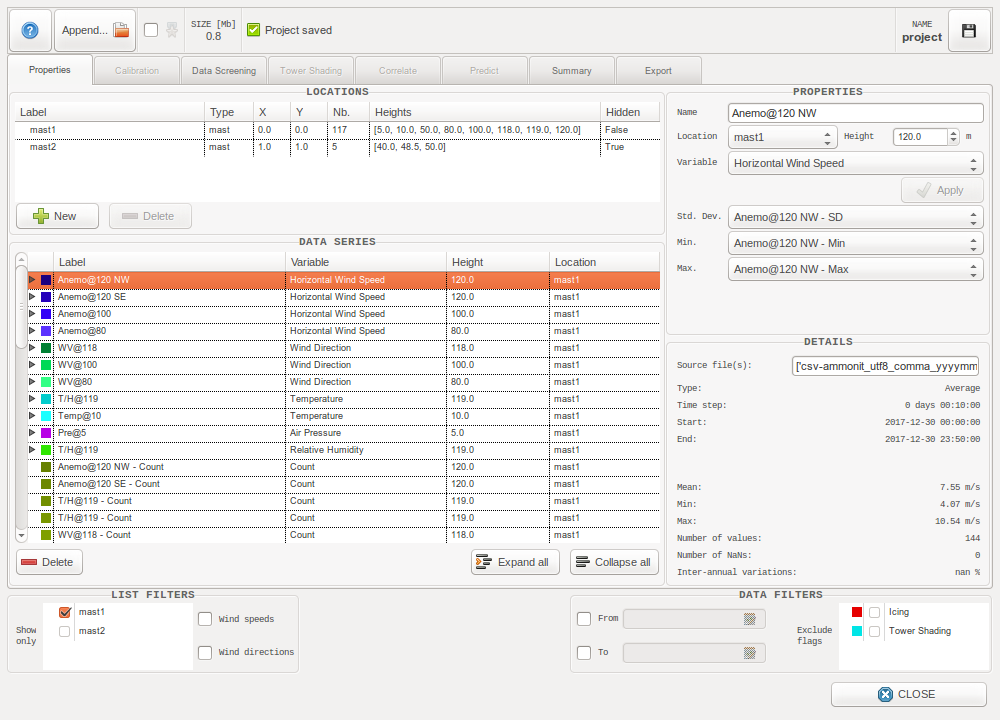
属性选项卡
数据导入

小技巧
在选择要导入的文件时,可以选择几个文件同时导入
支持的格式
ZephyWDP目前只能导入类似文本的文件。 支持的格式如下:
| 源名称 | 源种类 | 文件拓展名 | 源公司 |
|---|---|---|---|
| EOL 管理器 | 软件 | .csv, .wnd | Kintech Engineering |
| Meteo-40 | Data Logger | .csv | Ammonit |
| Meteodyn WT | 软件 | .tim | Meteodyn |
| NDL 485 | Data Logger | .csv | Wilmers Messtechnik |
| TOA5 data files | Data Logger | .dat | Campbell Scientific |
| Symphonie Data Retriever | 软件 | .txt | NRG Systems |
| Windcube, Wind Iris | Wind Lidar | .sta, .stdsta | Leosphere |
| Windnavigator | 软件 | .txt | AWS Truepower |
| Windographer | 软件 | .txt | AWS Truepower |
| windPRO | 软件 | .txt | EMD International |
| ZephyCFD | 软件 | .zsvd, .zsvds | Zephy-Science |
| ZX300, ZX300M, ZXTM | Wind Lidar | .csv | ZXLidars |
For these formats the software will parse a variety of meta-data, some of which getting special treatment:
GPS coordinates
When GPS coordinates are available, they are converted to the georeference system specified when the project was created. A corresponding new location (cf. Locations) will be created and all data series from the file will be associated to it.
Timezones
When a timezone is specified, an time offset is applied to the data to effectively shift it to UTC+0. This ensures that files with different timezones can still be correctly viewed and compared in one same project.
自定义格式
ZephyWDP能够自动分析文件来猜测其格式,所以它实际上并不受限于上一节中列出的格式。
如果您想要在软件中加载不支持的文本类文件,请按照以下步骤使其兼容:
- 使用.csv或.txt扩展名
- 删除文件中的所有注释行
- 确保时间序列在第一列
- 确保时间序列不跨越多个列
完成了!尽管列类型(avg,sd,min,max)必须手动输入,并且可能还要输入单位和高度,但是现在应该可以在zephythools中正常加载您的文件了!
如果您希望在ZephyWDP中支持一个特定的格式,请告知我们,我们欢迎用户给我们提供宝贵的建议。
添加到现有系列
在已有数据序列的项目中加载新文件时,将弹出“添加到现有系列”窗口。
这个窗口让用户选择每个新的数据系列,看他们是否愿意:
- 将其添加为一个新系列。
- 忽略它
- 将它附加到现有的系列中
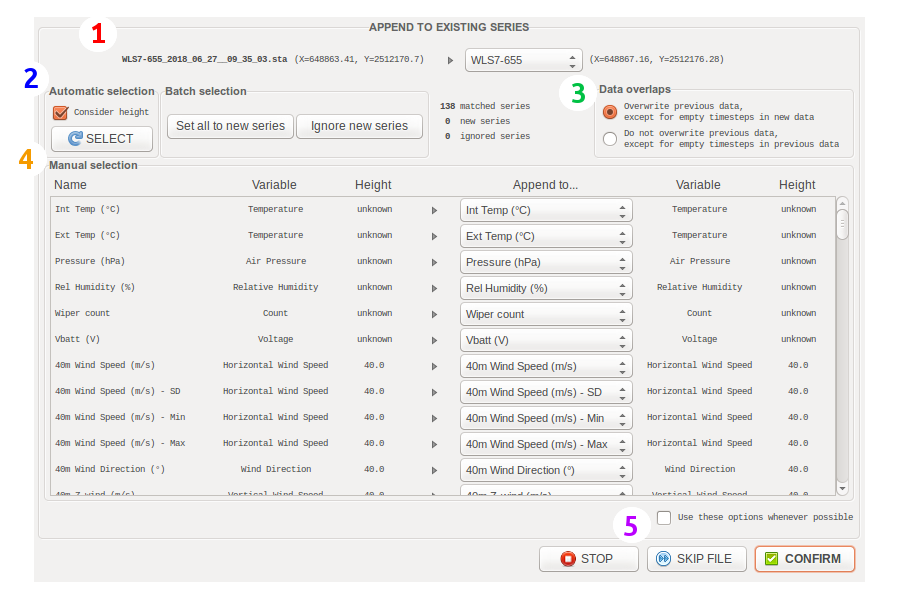
“添加到现有系列”窗口
1/ Location
To append data to an existing project, it is necessary to choose a location on which to append the series. It is possible to define a new one by selecting “New Location”.
The selected location restrains the automatic selection algorithm as well as the manual selection comboboxes (avoiding to get an excessively large number of entries in each combobox).
When GPS coordinates are available in the imported file, they are compared with the existing locations in the project. This can be useful for example to load data from a moving lidar which has different geolocation info in each file.
If these coordinates are close to an existing location (<15m), this location will automatically be selected. Otherwise the default behaviour is to define a new location.
2/ Automatic and Batch selection
Some automatic and batch actions are available to quickly map the new series with the existing ones (on the selected location).
ZephyWDP will automatically try to map the new series with existing ones considering the meta-data they both had on importation. It is possible to redo this selection with the “SELECT” button. Unticking “Consider height” will remove height from the list of meta-data to be tested.
The “Set all to new series” button allow to quickly set all the imported series to new series, while the “Ignore new series” will switch the imported series considered “New Series” to “Ignore” instead.
3/ Data overlaps
目前有两种方法可以在相互添加系列时处理数据迭代:
- 覆盖以前的数据,除了新数据中的空的迭代时间
- 除了之前数据中的空的迭代时间之外,不要覆盖以前的数据
4/ Manual selection
Use this panel to browse the imported series and verify that each one of them is mapped correctly.
5/ Confirm and continue the importation
The “STOP” button will stop the importation process now. This does not cancel the already processed files importations.
The “SKIP FILE” button is self-explanatory.
The “CONFIRM” button validates the settings and goes on with the importation process. If the checkbutton “Use these options whenever possible” is ticked, ZephyWDP will store the current appending configuration and apply it without asking (whenever it finds a file with the exact same series meta-data and GPS coordinates).
位置
Locations act as containers for the data series, and bring additional meta-data to them. Each data series can be associated to one single location, while each location can hold serveral data series.
When importing data, ZephyWDP automatically analyzes the available coordinates to create an associated location.
The Properties Tab shows the list of defined locations under the LOCATIONS frame. The EDIT PROPERTIES frame allows to modify their meta-data, i.e.:
- 名称
- Type (Meteorological mast, Lidar, Wind turbine…)
- X and Y coordinates (in the project’s georeference)
As of version 20.08, this feature only allows to filter treeviews and comboboxes of data series by location (cf. List filters). In the future, it is intended to help for correlation and gap filling purposes, as well as to allow ZephyCFD to use the data for automatic wind modeling validations.
Data Series
The Properties Tab is mainly meant for editing the series meta-data i.e.:
- 名称
- Location
- Measurement height
- Variable (horizontal wind speed, wind direction, temperature, air pressure, etc)
可以从 “编辑属性” 框架中的条目修改此元数据。可以一次修改多个系列的属性 (参考 批量处理属性修改 )。
系列测量平均值 (类型 “Avg”) 可以对以下每个系列有一个子系列:
- 标准偏差 (类型 “SD”)
- 极小值 (类型 “Min”)
- 极大值 (类型 “Max”)
子系列放在列表中的母系列之后,放在一个可折叠节点中。
可以从 “编辑子系列” 框架中的组合框定义这些子级。当一个系列被选择为子类时, 它的类型从 “Avg” 切换到相关类型,并且它不能再容纳自己的子系列。它的元数据也在进程中重新定义, 以匹配母系列。
任何系列都可以使用 “删除” 按钮完全删除。注意,这是 ZephyWDP 中不能撤消的操作。
批量属性修改
就像ZephyWDP中的大多数树状图一样,在属性选项卡中,可以一次选择多个系列。 当选择几个系列时,他们的元数据可以同时定义。
更具体地说,名称条目具有高级的批量修改功能:ZephyWDP可以分析所有选定的名称来找到公共的前缀和后缀。 名称条目的格式如下:前缀<名称>后缀,其中前缀和后缀是公共前缀和后缀,而<name>用于区分不同的序列。
它允许修改或删除通用的前缀和后缀,同时保持每个系列名字里特有的部分的完整性。 请注意,甚至可以通过键入类似myprefix <name> blahblah <name> mysuffix的方式复制每个系列的特定部分,因为每个<name>都将被解析和替换。
注解
要有效地选择所有的子系列以及它们的母系列,首先必须扩展母节点。要快速展开多个节点,可以使用列表下面的“展开所有”按钮。
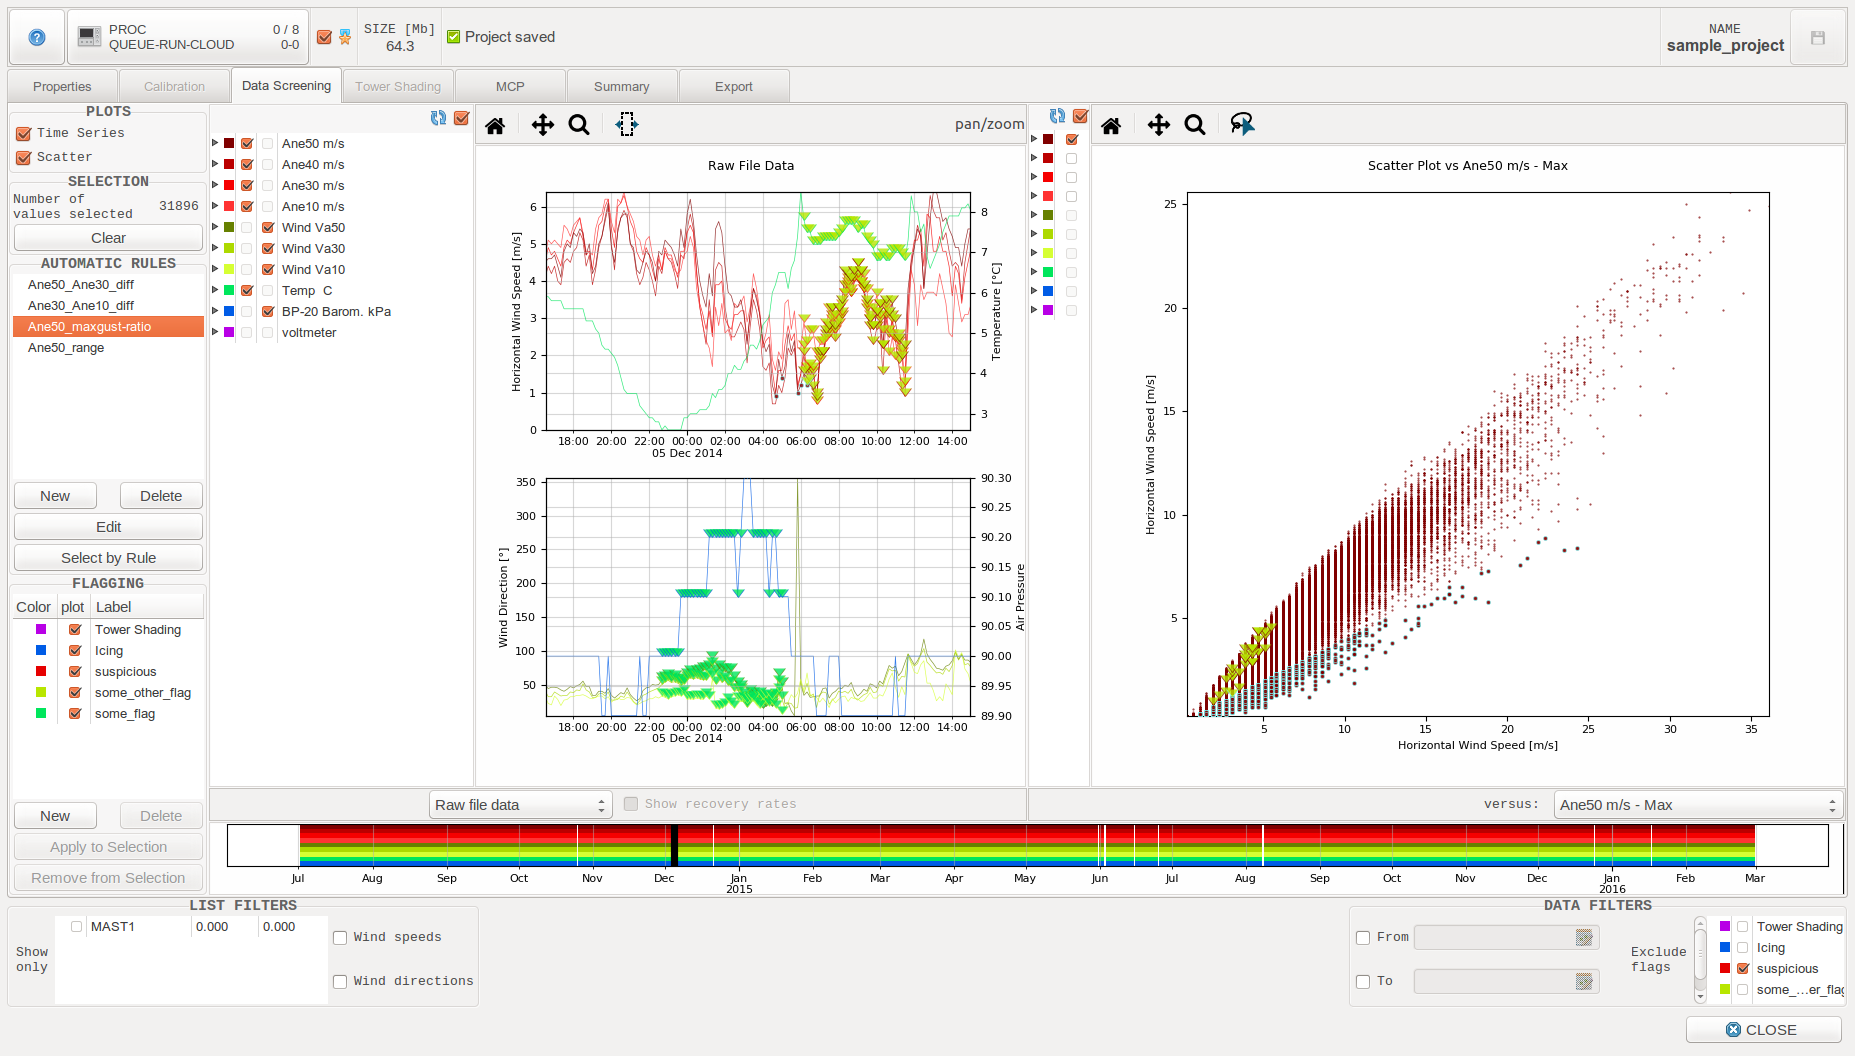
数据显示选项卡
数据显示选项卡
数据显示选项卡允许按时间序列和/或离散图格式可视化数据,并可使用手动选择和/或根据选择规则在一个窗口中快除速定义,添加和删标志。
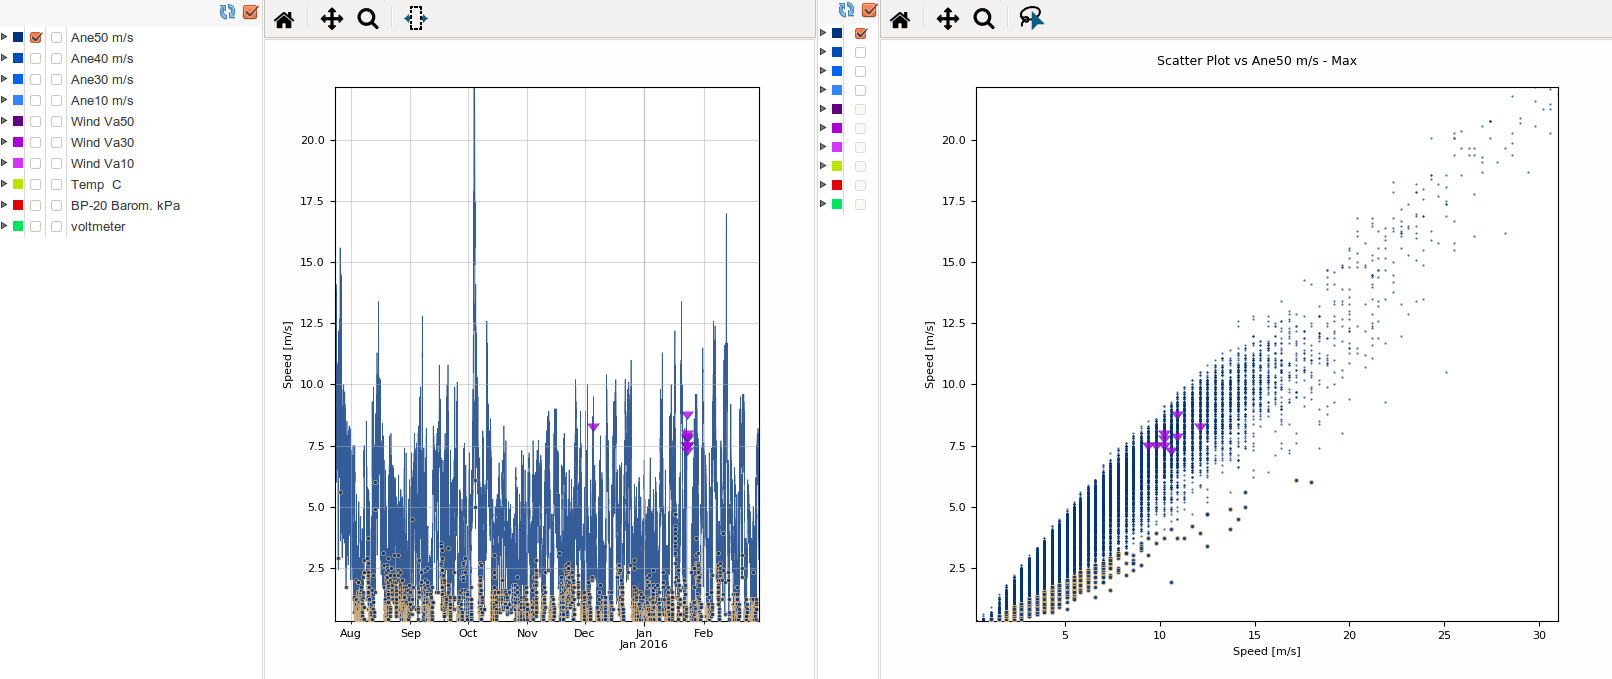
时间序列图
时间序列图是默认激活的。 使用左上角PLOTS框中的相应检查按钮来激活/取消激活。
1. Series selection
通过在绘图区域左侧的列表中勾选它们来选择要绘制的系列。 可以定义两个独立的图,因此列表中有两个不同的选择按钮列。
可以通过扩展它们的父节点来访问“SD”,“Min”和“Max”系列。

这个列表上按钮可以激活/取消激活图像的自动刷新。取消激活的话,就可以轻松地勾选/取消勾选数据系列,不需要等待图像刷新。
2. Plot options
可以绘制:
- 原始文件数据
- 日平均值
- 周平均值
- 月平均值
- 年平均值
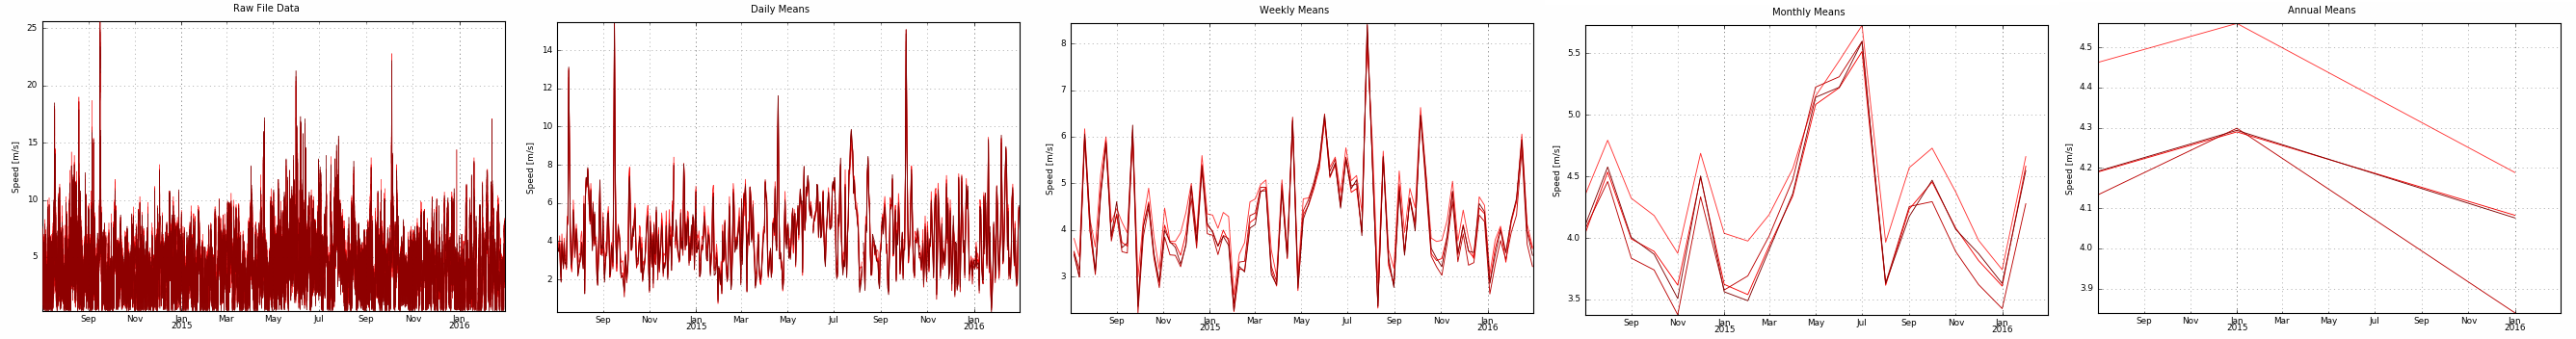
另外,在绘平均值图时,它可以将恢复率在平均值后显示为直方图。
3. Interactive navigation and selection tools

|
将绘图边界与数据匹配 |

|
用鼠标平移坐标轴,向右放大 |

|
缩放时间轴 |

|
在该时间范围内选择数据 |
鼠标滚轮也可以用来放大和缩小绘图。
4. Timeline
除以前的工具外,数据显示选项卡还包含一个时间轴导航器:
这个小图显示了所选系列的数据覆盖范围,并表示当前用黑色矩形窗口绘制的时间跨度。
移动此黑色矩形或在时间轴内选择新的时间跨度将导致时间序列图相应地更新其边界,从而可以轻松浏览整个数据集。
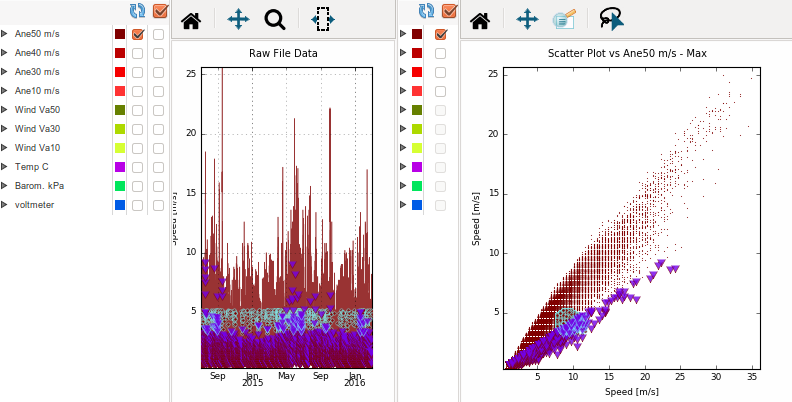
离散图
离散图在默认情况下是停用的。 使用左上角PLOTS框中的相应检查按钮来激活/取消激活它。
1. Series selection
在绘图区域左侧的列表中勾选它们来选择要绘制的系列。
可以通过扩展它们的父节点来访问“SD”,“Min”和“Max”系列。
这个列表上按钮可以激活/取消激活图像的自动刷新。取消激活的话,就可以轻松地勾选/取消勾选数据系列,不需要等待图像刷新。
注解
如果时间序列图和离散图均被激活,则离散图的系列列表将仅显示系列颜色以节省屏幕空间。 系列元数据仍然可以在工具提示中查看。
2. Plot options
用户必须选择他想要执行离散图的系列。 只能选择具有相同时间序列的系列进行绘图。
3. Interactive navigation and selection tools
|
|
将绘图边界与数据匹配 |
|
|
用鼠标平移坐标轴,向右放大 |
|
|
缩放时间轴 |

|
绘制一个区域选择其中的点 |
鼠标滚轮也可以用来放大和缩小绘图。
数据选择
Slices of data can be selected by various means. Selected data can then be flagged or unflagged as needed.
In addition to the interactive selection tools introduced in Time Series Plots and Scatter Plot, some automated actions are available from the left side of the Data Screening Tab:
自动规则
自动规则框架提供了执行数据自动筛选所需的工具。 在那里,用户可以创建,应用和删除一些自定义的自动选择规则:
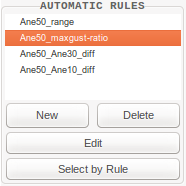
这些规则不会直接将标志应用到数据中,而是只会选择它,这样用户就可以添加/移除他们喜欢的任何标志到这个选择中。(参考 标志 )
当用户决定创建新的规则时,自动规则配置窗口会弹出:
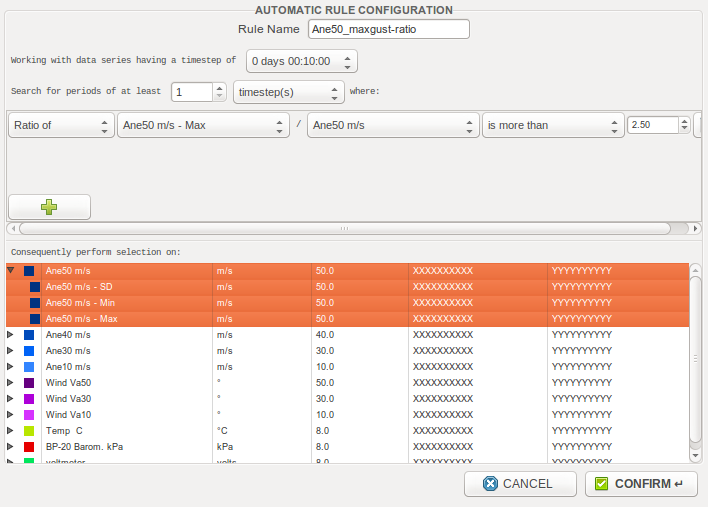
- ZephyWDP支持在同一个项目中使用不同时间步长的系列,但对于自动规则,首先需要指定将使用哪种时间步长。
- 可以定义这些数据的最小周期长度,低于该长度将不会被选择。
- 用户必须定义一个或多个选择逻辑条件的自定义规则(这些规则之间是“和”的关系)。可以为单个系列或系列的差异/比率定义规则。
- 最后,用户选择他们想要执行规则的系列。
标志寄存器
Flags can be added and removed at will from selected data. They then allow to filter erroneous data.
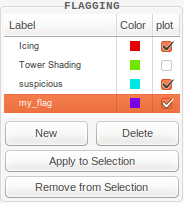
定义新标志时,用户只需为其定义一个名称即可。然后用户可以从当前的选择中添加或删除此标志。
注意,通过在框中同时选择几个标志,可以一次添加/移除多个标志。此外,您还可以通过勾选/取消在“绘图”列中相应的校验按钮来选择要绘制的标志标记。
在上图中,注意如果选择了相应的数据,标志边缘颜色会改变。
Once erroneous data has been flagged, it can be filtered out by simply activating the corresponding flag filter from the Data filters frame.
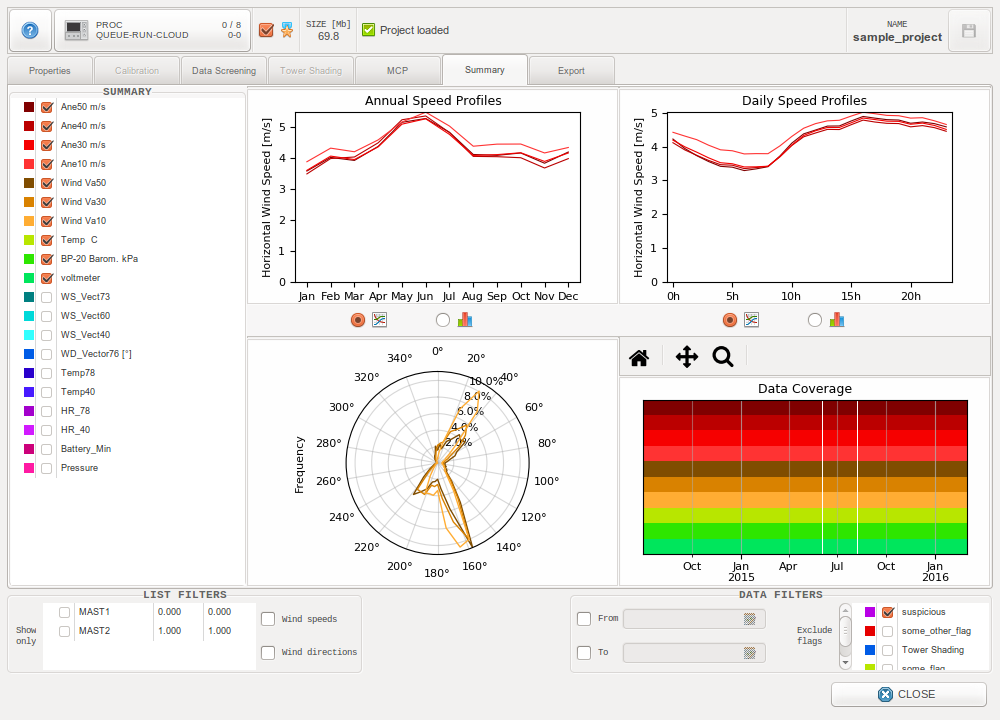
MCP Tab
ZephyWDP provides Measure Correlate Predict (MCP) methods based on the XGBoost machine learning algorithm.
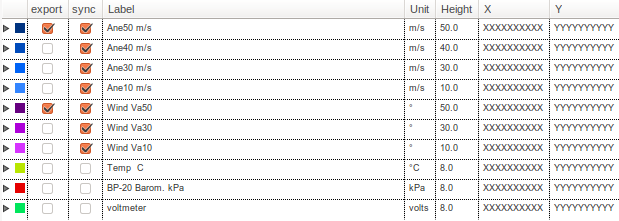
导出选项卡
导出选项卡可以将数据导出到ZephyTOOLS文件库(参考 输入文件 )和外部文件。
支持的格式
- zsvd -
用ZephyCFD风数据格式“.zsvd”输出速度方向序列。
To be able to export a .zsvd file, you must tick exactly one horizontal wind speed series and one wind direction series in the “export” column. If you select additional series that are neither speeds nor directions, they will be added to the file as optional columns.
- 使用“导出.zsvd文件”导出到外部文件。
- 使用“将.zsvd添加到文件数据库”将其直接添加到ZephyTOOLS的输入文件库中。
一些可用的选项:
- “导出时间序列”: 虽然在 ZephyCFD 中不使用时间序列,但可以将它们添加为可选列, 以便以后在导出的系列中获取它们。
- “将比例系数应用于风速”: 使用此选项可以很容易地获得对 CFD 模型的灵敏度分析所需的输入数据。
注解
如果选定的速度序列有一个与之相关的标准偏差序列,则ZephyWDP将自动切换到“.zsvds”格式(velocity-direction-sigma)。
在ZephyCFD中,当使用.zsvds文件时,外推过程将计算参考湍流强度(TI)矩阵,并用它来外推测得的TI以及速度和方向。 这对于点位适宜性研究特别有用。
-CSV-
使用“导出.csv表格文件”将类似表格的.csv格式的系列导出到外部文件。与zsvd格式不同,它对于要导出的系列的选择没有限制。
并行系列出口
可以控制导出过程,以便只保留您选择的每个系列中的有效数据的时间步长。
这是通过选择必须在“同步”列中并存的所有系列来实现的。
请注意,此方法不仅可以保持同一输出的系列同步,还可以保持在多个不同输出中的系列同步(例如多个zsvd输出)。
选择导出并行zsvd文件,预测其他并行文件,这些文件稍后也会导出。