ZephyWDP
The ZephyWDP software is developed by Zephy-Science for fast and intuitive wind data analysis and processing.

The Data Screening Tab in ZephyWDP
Workflow overview
ZephyWDP interface is structured by the logical steps in any wind data processing project:
- It is separated into several tabs, each one corresponding to a different step in the process.
- The user will go through these tabs mainly from left to right.
- Some options and actions common to every steps are accessible above and below the tabs

The intended workflow is to gather all your different onsite data sets into one single project, as ZephyWDP supports sorting and structuring the data by measurement locations (cf. Locations). This structure then allows to analyze all the available measurements against each other, as well as to perform some gap filling and extrapolation.
About the common buttons and actions:

|
Access to this documentation |
|
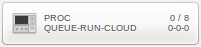
Access the Queuing management window |

|
Add/remove project from your favorites |

|
Save the project |
Warning
Unlike ZephyCFD where the projects are saved after every action, in ZephyWDP it is needed to manually save the projects. This is meant to avoid freezes in the workflow, since ZephyWDP may have to write large amounts of data on the hard-drive on each save.
Remember to save frequently!
Note
Some tabs are grayed out as they have not be implemented yet, but we will make them available in future versions.
List filters
The “LIST FILTERS” frame in the window’s footer gives some option to filter which time series are shown in the treeviews and comboboxes. These filters effectively apply to all Tabs in ZephyWDP.
|
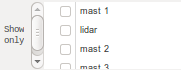
Show only time series from the selected locations. |
|
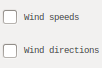
Show only wind speeds and/or directions. |
Note
When a list filter is defined, some time series are hidden in the treeviews but they stay visible in plots, and selection rules based on them are still applicable.
Data filters
The “DATA FILTERS” frame in the window’s footer gives some option to filter the time series data. These filters effectively apply to all Tabs and all tools available in ZephyWDP (including exportation).
|
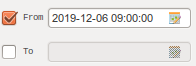
Filter all the series using a starting date and/or ending date. Click the icon on the entry’s right to access a calendar widget. |
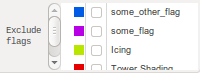
|
Filter all the series to exclude data having a given flag. |
Note
When a data filter is defined, ZephyWDP will behave as if the corresponding data had been deleted, while still giving the possibility to recover it by simply deactivating the filter.
Properties Tab
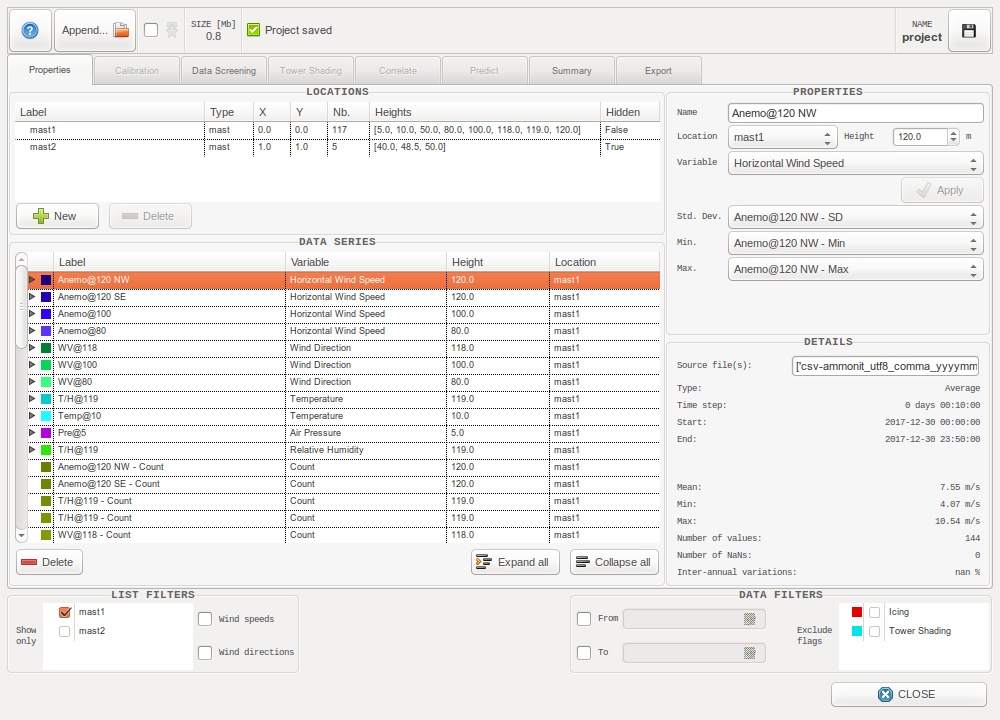
The Properties Tab
Data Importation

Tip
When choosing the file(s) to import, select several ones to import them all at once!
Supported formats
ZephyWDP can currently only import text-like files. The supported formats are the following:
| Source name | Source type | File extension | Source company |
|---|---|---|---|
| EOL Manager | Software | .csv, .wnd | Kintech Engineering |
| Meteo-40 | Data Logger | .csv | Ammonit |
| Meteodyn WT | Software | .tim | Meteodyn |
| NDL 485 | Data Logger | .csv | Wilmers Messtechnik |
| TOA5 data files | Data Logger | .dat | Campbell Scientific |
| Symphonie Data Retriever | Software | .txt | NRG Systems |
| Windcube, Wind Iris | Wind Lidar | .sta, .stdsta | Leosphere |
| Windnavigator | Software | .txt | AWS Truepower |
| Windographer | Software | .txt | AWS Truepower |
| windPRO | Software | .txt | EMD International |
| ZephyCFD | Software | .zsvd, .zsvds | Zephy-Science |
| ZX300, ZX300M, ZXTM | Wind Lidar | .csv | ZXLidars |
For these formats the software will parse a variety of meta-data, some of which getting special treatment:
GPS coordinates
When GPS coordinates are available, they are converted to the georeference system specified when the project was created. A corresponding new location (cf. Locations) will be created and all data series from the file will be associated to it.
Timezones
When a timezone is specified, an time offset is applied to the data to effectively shift it to UTC+0. This ensures that files with different timezones can still be correctly viewed and compared in one same project.
Custom Formats
ZephyWDP automatically analyzes any file to guess its format, so it is not actually restrained to the formats listed in the previous section.
If you have unsupported text-like files that you would like to load in the software, follow these steps to make it compatible:
- Use a .csv or .txt extension
- Remove all comment lines from the file
- Ensure that the timestamps are in the first column
- Ensure that the timestamps do not span on several columns.
Done! Your files should now load normally in ZephyTOOLS, although the column types (Avg, SD, Min, Max) will have to be inputed manually, and possibly the units and heights as well.
If you would like a specific format to be supported natively in ZephyWDP, let us know as we welcome all suggestions from our users.
Append to existing series
When loading new files in a project which already has data series, the “Append to existing series” window will pop up.
This window lets the user choose for each new data series whether they would like to:
- Add it as a new series
- Ignore it
- Append it to an existing series
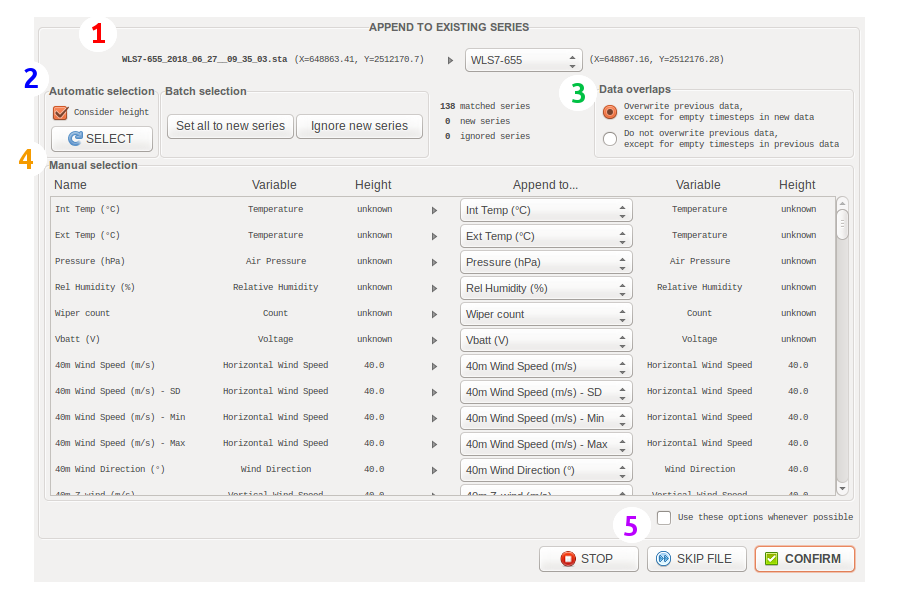
The “Append to existing series” window
1/ Location
To append data to an existing project, it is necessary to choose a location on which to append the series. It is possible to define a new one by selecting “New Location”.
The selected location restrains the automatic selection algorithm as well as the manual selection comboboxes (avoiding to get an excessively large number of entries in each combobox).
When GPS coordinates are available in the imported file, they are compared with the existing locations in the project. This can be useful for example to load data from a moving lidar which has different geolocation info in each file.
If these coordinates are close to an existing location (<15m), this location will automatically be selected. Otherwise the default behaviour is to define a new location.
2/ Automatic and Batch selection
Some automatic and batch actions are available to quickly map the new series with the existing ones (on the selected location).
ZephyWDP will automatically try to map the new series with existing ones considering the meta-data they both had on importation. It is possible to redo this selection with the “SELECT” button. Unticking “Consider height” will remove height from the list of meta-data to be tested.
The “Set all to new series” button allow to quickly set all the imported series to new series, while the “Ignore new series” will switch the imported series considered “New Series” to “Ignore” instead.
3/ Data overlaps
There are currently two options to handle data overlaps when appending series to each other:
- Overwrite previous data, except for empty timesteps in new data
- Do not overwrite previous data, except for empty timesteps in previous data
4/ Manual selection
Use this panel to browse the imported series and verify that each one of them is mapped correctly.
5/ Confirm and continue the importation
The “STOP” button will stop the importation process now. This does not cancel the already processed files importations.
The “SKIP FILE” button is self-explanatory.
The “CONFIRM” button validates the settings and goes on with the importation process. If the checkbutton “Use these options whenever possible” is ticked, ZephyWDP will store the current appending configuration and apply it without asking (whenever it finds a file with the exact same series meta-data and GPS coordinates).
Locations
Locations act as containers for the data series, and bring additional meta-data to them. Each data series can be associated to one single location, while each location can hold serveral data series.
When importing data, ZephyWDP automatically analyzes the available coordinates to create an associated location.
The Properties Tab shows the list of defined locations under the LOCATIONS frame. The EDIT PROPERTIES frame allows to modify their meta-data, i.e.:
- Name
- Type (Meteorological mast, Lidar, Wind turbine…)
- X and Y coordinates (in the project’s georeference)
As of version 20.08, this feature only allows to filter treeviews and comboboxes of data series by location (cf. List filters). In the future, it is intended to help for correlation and gap filling purposes, as well as to allow ZephyCFD to use the data for automatic wind modeling validations.
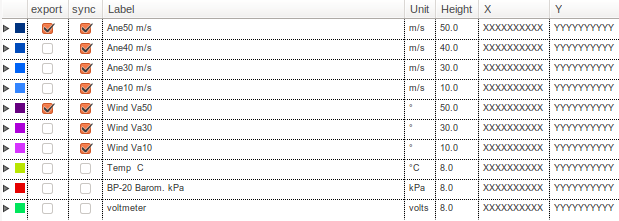
Data Series
The Properties Tab is mainly meant for editing the series meta-data i.e.:
- Name
- Location
- Measurement height
- Variable (horizontal wind speed, wind direction, temperature, air pressure, etc)
This meta-data can be modified from the entries in the EDIT PROPERTIES frame. It is possible to modify the properties of several series at once (cf Batch properties modifications).
Series of measurement averages (type “Avg”) can have one child series for each of the followind types:
- Standard Deviations (type “SD”)
- Minima (type “Min”)
- Maxima (type “Max”)
Children series are put after their parent in the list, in a foldable node.
These children can be defined from the comboboxes in the EDIT CHILD SERIES frame. When a series is selected as child, its type switch from “Avg” to the relevant type and it can no longer accept children of its own. Its meta-data is also redefined in the process to match the parent series.
Any series can be completely removed using the Delete button. Watch out as this is one of the only action in ZephyWDP that cannot be undone.
Batch properties modifications
Like in most of the treeviews in ZephyWDP, in the Properties Tab it is possible to select several series at once. When several series are selected, their meta-data can be defined at once.
More specifically, the name entry have advanced batch modification features:
ZephyWDP analyzes all the selected names to find common prefixes and suffixes.
The name entry is then formatted as follow: prefix<name>suffix where prefix and suffix are the common prefix and the suffix,
while <name> is displayed to denote the part of the name which varies from one series to another.
This allows to modify or delete common prefixes and suffixes while keeping intact the part specific to each series.
Note that one could even duplicate the part specific to each series by typing something like myprefix<name>blahblah<name>mysuffix
since each <name> will be parsed and replaced.
Note
To effectively select all the children series along with their parents, you must first expand the parent node. To quickly expand several nodes, you can use the “Expand all” button below the list.
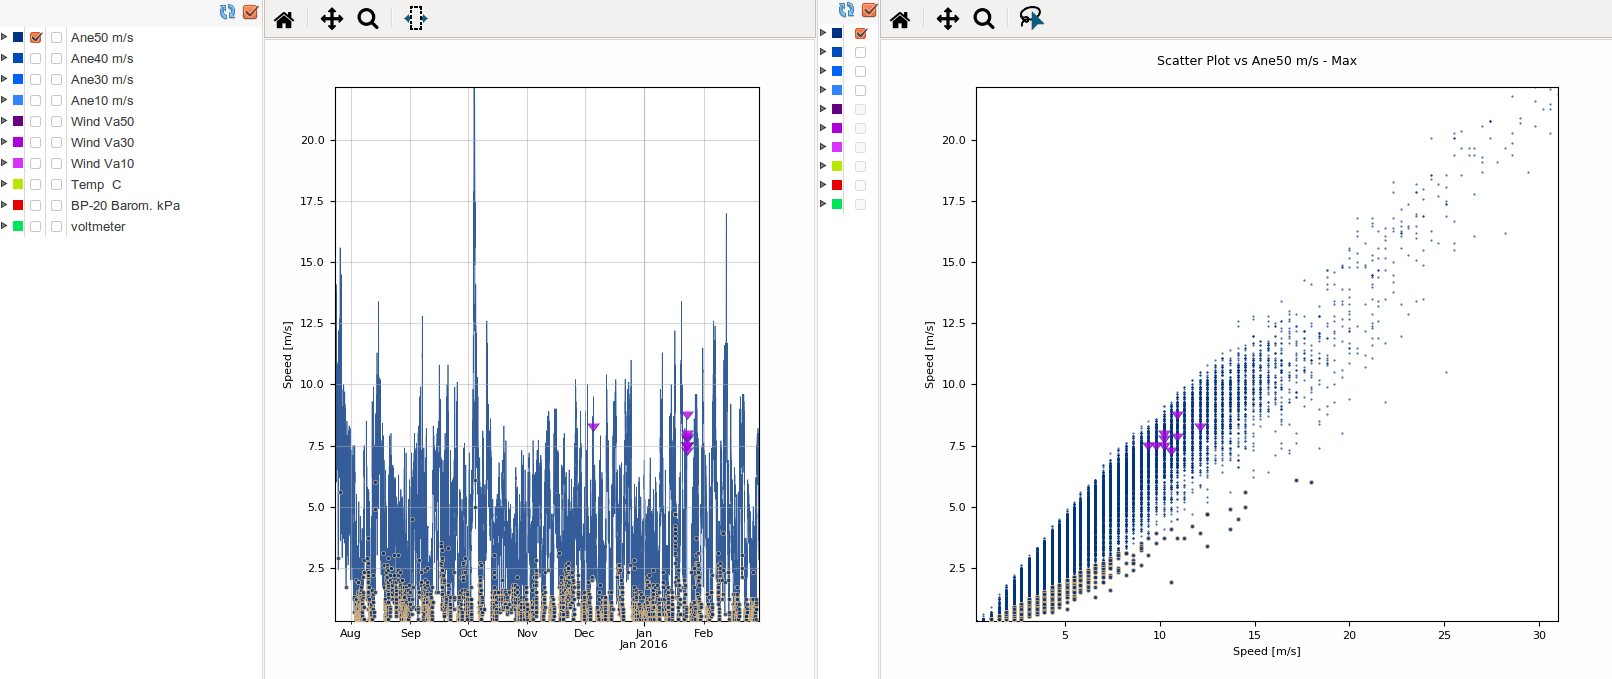
Data Screening Tab
The Data Screening Tab
The Data Screening Tab allows to visualize data in time series and/or scatter plot formats, and to quickly define, add and remove flags using manual selection and/or selection rules, all in one single window.
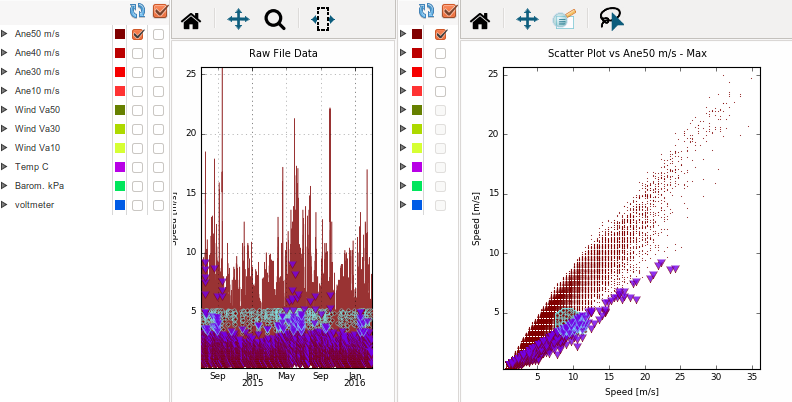
Time Series Plots
The time series plot is activated by default. Use the corresponding checkbutton in the PLOTS frame in the upper left corner to activate/deactivate it.
1. Series selection
The series to be plotted are selected by ticking them in the list on the left side of the plot area. Two separate plots can be defined, hence the two different checkbuttons columns in the list.
“SD”, “Min” and “Max” series can be accessed by expanding their parent node.

This checkbutton above the list allows to activate/deactivate the automatic refresh of the plot. Deactivate it to easily tick/untick many series without having to wait for the plot to refresh in-between.
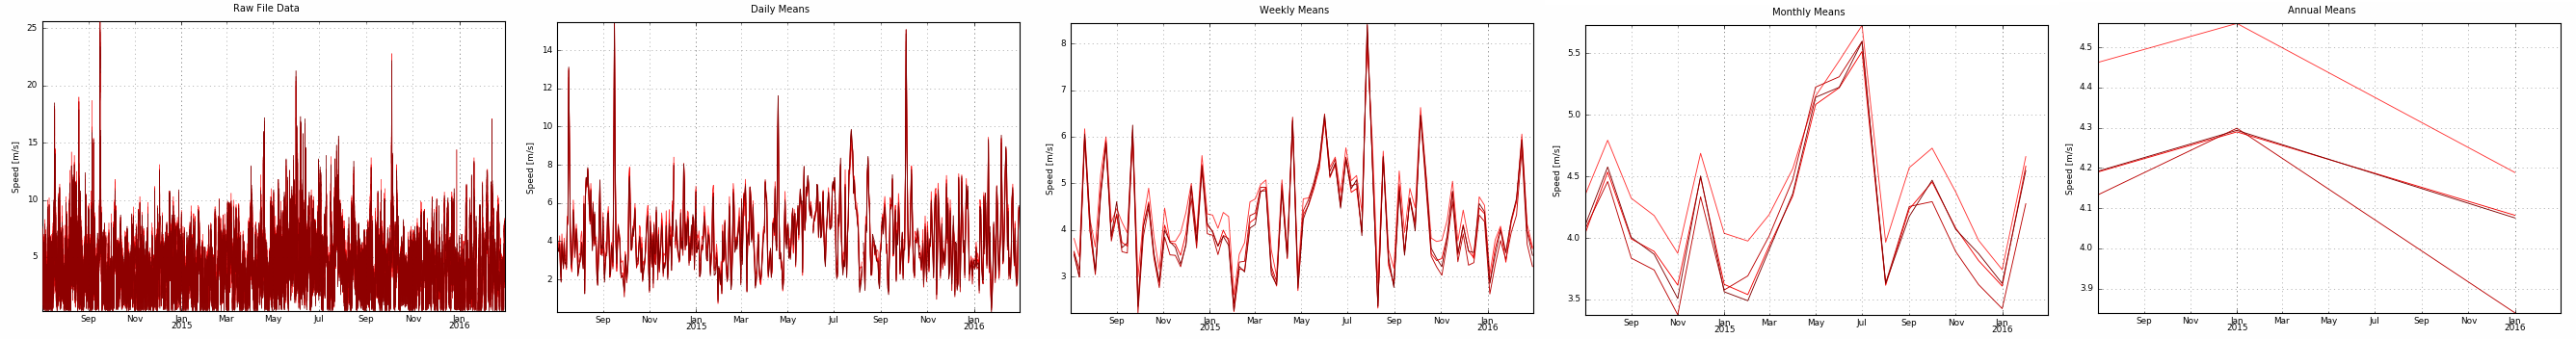
2. Plot options
It is possible to plot either:
- The raw file data
- The daily means
- The weekly means
- The monthly means
- The annual means
Additionally, when plotting means one can show the recovery rates as a histogram behind the means.
3. Interactive navigation and selection tools

|
Fit the plot boundaries to the data |

|
Pan axes with left mouse, zoom with right |

|
Zoom to time span |

|
Select data in time span |
The mouse wheel can be used to zoom in and out of the plot as well.
4. Timeline
In addition to the previous tools, the Data Screening Tab features a Timeline Navigator:
This little plot shows the data coverage of the selected series, and represents the time span currently plotted with a black rectangle window.
Moving this black rectangle or selecting a new time span within the timeline will cause the time series plots to update their boundaries accordingly, allowing to easily navigate through the whole dataset.
Scatter Plot
The scatter plot is deactivated by default. Use the corresponding checkbutton in the PLOTS frame in the upper left corner to activate/deactivate it.
1. Series selection
The series to be plotted are selected by ticking them in the list on the left side of the plot area.
“SD”, “Min” and “Max” series can be accessed by expanding their parent node.
This checkbutton above the list allows to activate/deactivate the automatic refresh of the plot. Deactivate it to easily tick/untick many series without having to wait for the plot to refresh in-between.
Note
If both the time series plot and the scatter plot are activated, the series list for the scatter plot will only show the series colors to save space on the screen. The series meta-data can still be viewed in the tooltips.
2. Plot options
The user has to select the series against which he wants to perform the scatter plot. Only series with the same timestep can then be selected to be plotted.
3. Interactive navigation and selection tools
|
|
Fit the plot boundaries to the data |
|
|
Pan axes with left mouse, zoom with right |
|
|
Zoom to time span |

|
Draw an area to select the points within |
The mouse wheel can be used to zoom in and out of the plot as well.
Data selection
Slices of data can be selected by various means. Selected data can then be flagged or unflagged as needed.
In addition to the interactive selection tools introduced in Time Series Plots and Scatter Plot, some automated actions are available from the left side of the Data Screening Tab:
Clear selection
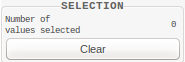
This frame displays how many data points are currently selected, and allows to unselect them all using the Clear button.
Automatic Rules
The AUTOMATIC RULES frame provides the tools necessary to perform automated screening of the data. From there, the user can create, edit, apply and delete some customized automated selection rules:
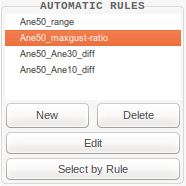
These rules will not directly apply flags to the data, but rather they will just select it, so that the user can then add/remove any flag they please to this selection (cf. Flagging).
When the user decides to create a new rule, the Automatic Rule Configuration window is popped up:
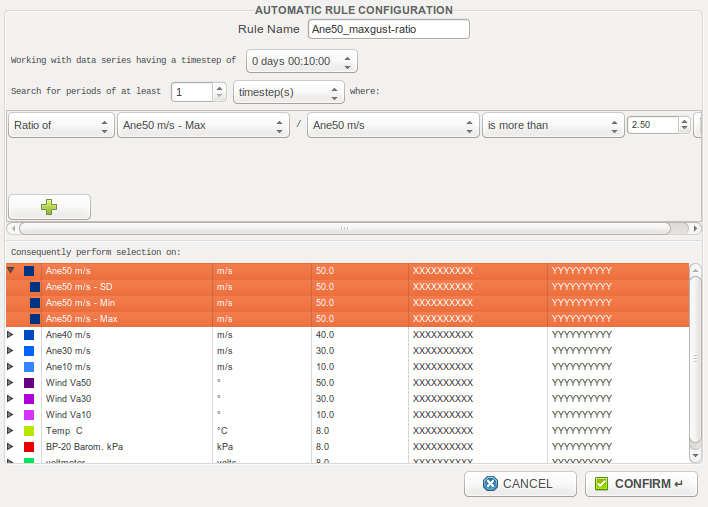
- ZephyWDP supports having series with different timesteps in one same project, but for an automated rule it is first necessary to specify which kind of timesteps it will be using.
- It is possible to define a minimal period length of concurrent data below which no selection will be performed.
- The user has to define one or several custom rules (“AND” relation between these rules) defining the selection logical conditions. Rules can be defined for single series or difference/ratio of series.
- Finally, the user selects on which series they want to perform the rule selection.
Flagging
Flags can be added and removed at will from selected data. They then allow to filter erroneous data.
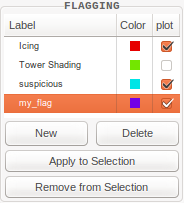
When defining a new flag, the user is simply prompted to define a name for it. It is then possible to add or remove this flag from the current selection.
Note that it is possible to add/remove several flags at once by selecting several flags in the frame. Additionally, you can choose which flag markers to plot by ticking/unticking the corresponding checkbutton in the “plot” column.
In the picture above, notice that the flags edge color change if the corresponding data is selected.
Once erroneous data has been flagged, it can be filtered out by simply activating the corresponding flag filter from the Data filters frame.
Summary Tab
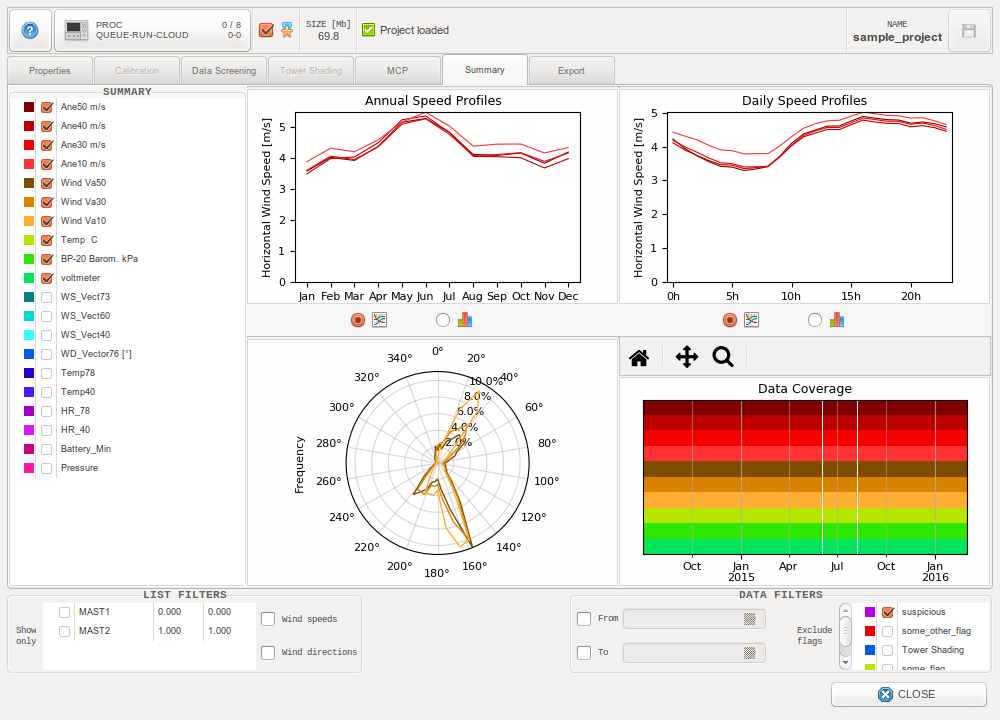
The Summary Tab
The summary tab allows to get an overview of the dataset characteristics, with plots of several commonly checked statistics as well as the data coverage.
MCP Tab
ZephyWDP provides Measure Correlate Predict (MCP) methods based on the XGBoost machine learning algorithm.
Export Tab
The Export Tab allows to export data series to ZephyTOOLS files library (cf. Input Files) and to external files.
Supported Formats
- zsvd -
Export velocity-direction series in ZephyCFD’s climatology format, “.zsvd”.
To be able to export a .zsvd file, you must tick exactly one horizontal wind speed series and one wind direction series in the “export” column. If you select additional series that are neither speeds nor directions, they will be added to the file as optional columns.
- Use “Export .zsvd file” to export to an external file.
- Use “Add .zsvd to Files Database” to directly add it to ZephyTOOLS’s Input Files library.
Some options are available:
- “Export timestamps” : while timestamps are not used in ZephyCFD, it is possible to add them as an optional column in order to later get them in the exported production series.
- “Apply Scale Factor to Wind Speeds” : Easily get the input needed for the sensitivity analysis of your CFD models by using this option.
Note
If the selected Speed series has a Standard Deviation series associated to it, ZephyWDP will automatically switch to the “.zsvds” format (velocity-direction-sigma).
In ZephyCFD, when using a .zsvds file, the Extrapolation process calculates the reference Turbulence Intensity (TI) matrix and use it to extrapolate the measured TI along with speed and direction. This is especially useful for Site Suitability studies.
- csv -
Export any series in a table-like .csv format to an external file, using “Export .csv table file”. Unlike the zsvd format, there is no restriction on what series to select for exportation.
Concurrent series exportation
It is possible to constrain the exportation process in order to keep only the time steps with valid data in every series of your choice.
This is achieved by selecting all series which have to be concurrent in the “sync” column.
Note that this method allows not only to keep synchronized the series of one same exportation, but also to keep synchronized series exported throughout several different exportations (e.g. several zsvd exportations).
Export selection for a concurrent zsvd file, anticipating for the other concurrent files which will later be exported too.