ZephyCFD
Introduction
The ZephyCFD software is developed by Zephy-Science for accurate and transparent wind farm modeling in complex terrains.
The software is based on the opensource OpenFOAM® [1] CFD solver and is powered by cloud computing servers (currently from Amazon Web Services). This approach allows to overcome the main limitations of traditional CFD methods by providing more accurate, more reliable and much faster wind farm modeling simulation results through a transparent interface.
ZephyCFD’s approach to Wind Modeling
The well-known WAsP linear estimations have limited accuracy in complex terrain. CFD was born to solve the problem of complex simulations and first introduced to the wind industry in the 2000s.
CFD users usually have a licensed software that allows them to launch several calculations on one machine. In such cases, the calculation speed is restricted by the computing power of one single machine. To deliver the project results in time, the engineers would have no choice but lowering the accuracy by simplifying the calculation models.
ZephyCFD is taking advantage of OpenFOAM® parallel CFD solver to perform highly parallelized calculations on Zephy-Science’s cloud computing platform, ZephyCloud. This allows parallel computing to achieve its full potential:
- Boosted accuracy and almost instant results: Users can launch as many servers as the projects require. Having the possibility to group these servers into clusters, the number of cores a single calculation can access is virtually endless.
- More time to investigate the results, to optimize the wind turbine layout, and to check the uncertainties.
- Several different projects can be sent simultaneously to the cloud servers.
Model Basis
ZephyCFD uses a 3D Reynolds Averaged Navier Stokes solver.
The non-linear transport equations for mass, momentum and energy are thus solved considering a steady-state and isotherm incompressible fluid.
The non linear Reynolds stress tensor is modeled by the k-epsilon dual equation closure scheme,
based upon coupled transport equations for the turbulent energy density k and the turbulent dissipation rate  .
.
The CFD results are stored as speed-up ratios and direction shifts relative to a chosen reference point of measurement. Several wind sectors are computed to cover all possible situations. Time series of wind speeds and directions can then be extrapolated to any point of interest, taking the assumptions that the calculated speed-up ratios and direction shifts are applicable to e.g. 10-min averaged measurements.
| [1] | The software itself has not been approved by the copyright owner OpenFOAM® and OpenCFD®, but using open source software will not cause infringement. AZIUGO is now a silver level OpenFOAM® supporter: Visit www.openfoam.org to find out more. |
Project definition
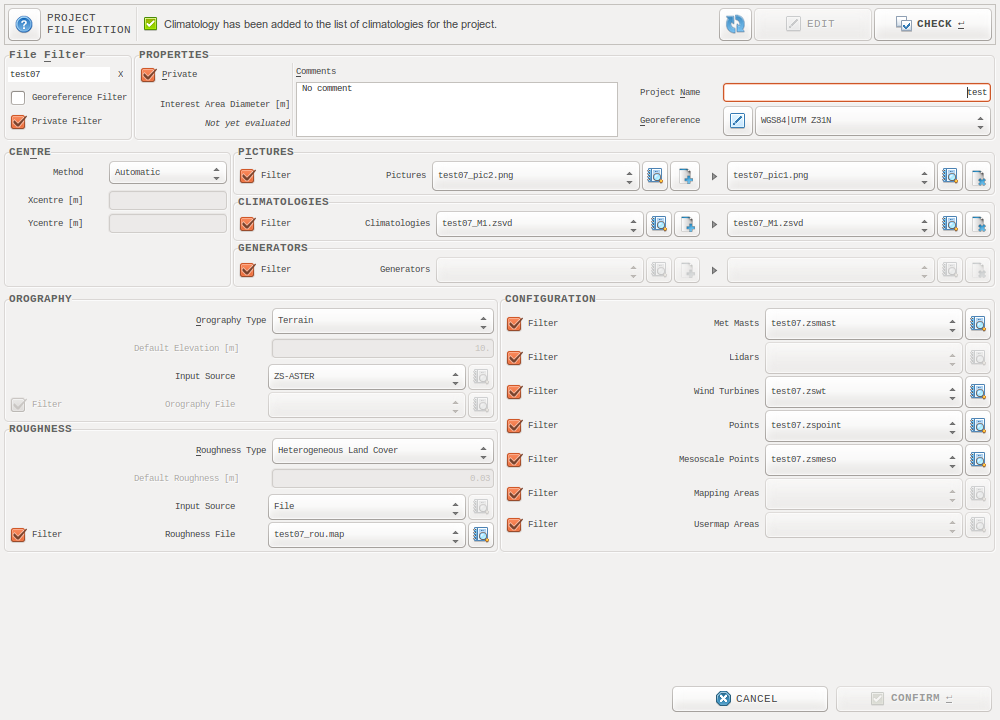
The project definition window
From this window, select all the input that shall be used in the project.
Note
To use input files, you must first load them in ZephyTOOLS Input Files database.
File Filter
Easily find your files in the many comboboxes by defining a filter on their name: Enter some text that must be included in the file name. Apply by hitting “Enter” on the keyboard.
Additionally, you can tick “Georeference Filter” to show only files within the selected georeference, and you can untick the “Private Filter” checkbox to show public input files.
PROPERTIES
A “Private” project will appear only the current user’s project list. It is the default value.
It is mandatory to define a georeference to be able to use input from the Databases. To find a new georeference, click the “Edit” button (
). This will open the Georeference options window where you can add georeferences to your personal list.
CENTRE
Choose a method to define the project’s center. This will impact the domain size, and thus the mesh size. The default value let ZephyTOOLS choose automatically.
PICTURES, CLIMATOLOGIES, GENERATORS
One or several of these files can be used in the same project, so each of them must be added with the “Add” (
) button.
These files are optional and can be added again later on, without consequences.
OROGRAPHY, ROUGHNESS
When defining the topography, the process is the same for both the orography and roughness:
- In the first combobox, define if the input should be flat/homogeneous or if it should be an actual heterogeneous input. The default is heterogeneous. In case it is flat/homogenous, define the value to use in the text entry just below.
- In the second combobox, specify if the input source is an input file or one of the built-in Databases. If a database is selected, ZephyTOOLS will automatically download and prepare the necessary data when loading the project.
- In case the source is an input file, choose it in the last combobox.
CONFIGURATION
Choose the Configuration files to use in the project.
Please note that it’s not possible to modify these files later on, at least not without consequences: To avoid running new calculations, it will be necessary to run a results post-extraction, which will create a duplicate of the project with the new input files.
Note
If your goal is to create wind maps, do not forget to define a mapping file with the bounds, heights and resolution you are interested in!
If left empty, ZephyTOOLS will automatically create mappings at the same heights as the circular visualizations, and with arbitrary bounds and resolution.
Note
some mapping files define a built-in georeference. If such a mapping is selected, its georeference will override the project’s one.
Workflow overview
ZephyCFD interface is structured by the logical steps in any CFD microscale wind modeling:
- It is separated into several tabs, each one corresponding to a different step in the project.
- The user will go through these tabs from left to right.
- Some options and actions common to every steps are accessible above the tabs

About the common buttons and actions:

|
Access to this documentation |
|
Access the Queuing management window |

|
Defines whether the different list of sets of parameters should only include the private ones, or if the public ones should also be made available. |

|
Defines whether the generated reports should be recursive or not (Check out Recursive Reports) |

|
Activate/Deactivate the confidentiality feature. When activated, all coordinates will be projected in an artificial georeference with the projetc’s center at (O,O). |

|
Add/remove project from your favorites |

|
Delete the project from ZephyCloud. Use this to stop the weekly invoice for cloud storage costs (cf. Storage Cost). |

|
Allows removing any of the non-essential files for optimized storing of the project. |

|
Investigate the use of ZephyCloud for this project. The upper number is the quantity of ZephyCoins left on your account, and the lower number is the quantity of ZephyCoins used for this project. |

|
Refresh the current window. |
All the different tabs are structured more or less the same way:
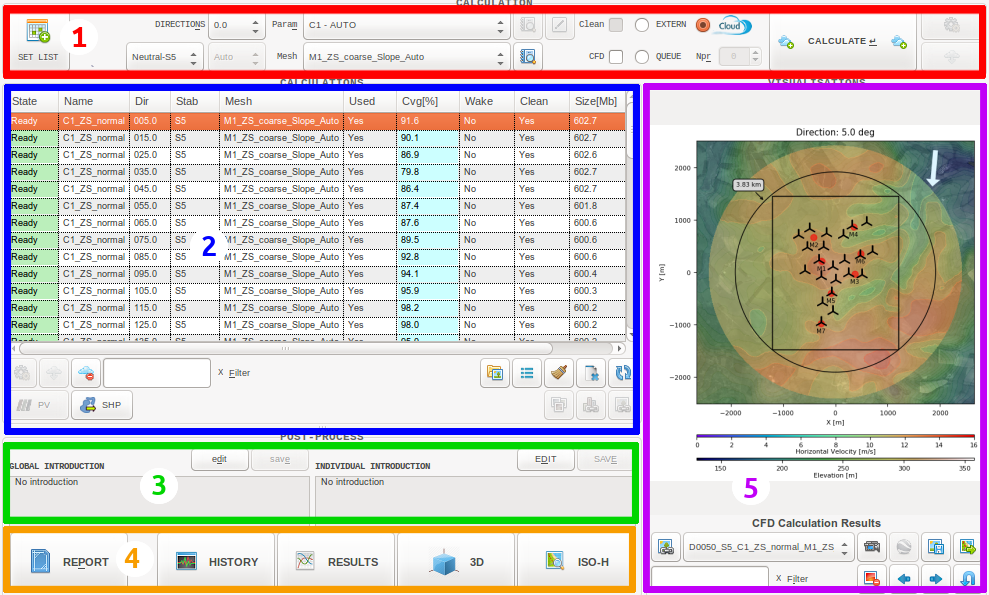
1. Process options and launch: The main process options are to be set here.
A set of parameters -related more closely to the algorithm at hand- has to be chosen as well. For each tab, these parameters are presented in this documentation under the section “Process parameters”.
The user has the possibility to save their own custom set of parameters, to reuse it later (check out Pre-Processing)
Buttons with this icon allow to edit the selected set of parameters.

Buttons with this icon allow to view details of the selected entity or set of parameters.

Buttons with this icon allow to launch new processes.

Buttons with this icon allow to monitor the selected process if it is still running.
2. Results list: This list allows to select and manage the different process results.

Buttons with this icon allow to remove the selected process results.

Buttons with this icon allow to remove the selected process from ZephyCloud (cf. Storage Cost).

Buttons with this icon allow to view the list of processes depending on the selected results.

Buttons with this icon allow to export inclusion zones as shapefiles, from a CFD or terrain variable.
3. Reporting: It is possible to write some comments which will be included in the software reports.
4. Post-processing: From this footer bar it is possible to generate visualizations, reports…
5. Visualizations management and preview: This frame allows to navigate through the visualizations and to export them.

Exports the selected visualization in kmz format to be opened in Google earth (if applicable).

Save the selected visualization to png format.

Save all visualizations in list to png format.

Deletes the selected visualization.

Go to previous visualization.

Go to next visualization.

Go to previously selected visualization.
The different steps of a ZephyCFD project are recapitulated here:
Loading
Before the numerical calculations, the 3D calculation domain needs to be discretized into a mesh, using orography and land cover data. The first step is simply to load the different files configuring the project.
From this tab it is also possible to get a first view of your project configuration, and later on to add some additional files to it (pictures, wind data, power curves…).
Analysis
This step will evaluate the terrain elevations at all the relevant locations.
It will also assess the project complexity, allowing ZephyCFD to adapt its automatic parameters in the next steps.
The user has the possibility to perform an additional RIX evaluation, which can consider climatology input in addition to terrain.
Meshing
Once the terrain elevations have been evaluated, the user can process with the domain meshing.
ZephyCFD uses a cylindrical mesh to simulate the wind flows in the project domain, which can be used to calculate any wind sector just by rotating the boundary conditions around the outer domain boundary.
This cylindrical mesh is generated using unstructured mesh techniques, so that it is possible to refine the horizontal and vertical resolutions around points of interest.
Zephy-Science suggests to define two different meshes in order to optimize the convergence of the calculations.
- A low-resolution mesh used to evaluate the wind characteristics for the non-prevailing directions according to the measured wind roses.
- A high-resolution mesh used to evaluate the wind characteristics for the prevailing directions according to the measured wind roses.
Calculations
OpenFOAM® is used to solve the Reynolds Averaged Navier-Stokes equations and simulate several wind sectors.
ZephyCFD thrives to offer a flexible interface, appealing to both CFD experts and newcomers: The user can either let the software choose automatically the wind sectors to calculate and the CFD parameters to use, or he can go himself customize all these with in-depth access to many parameters (solver, initialization, boundaries, turbulence…).
The convergence can then be monitored in real-time, even for calculations running in the cloud. Calculations can be stopped and restarted as much as needed to ensure convergence.
Rosing
Once several wind sectors have been calculated, their results have to be combined into a single model of the domain: For each wind characteristic, the relations between a reference point and every other point in the domain are calculated (speed-up ratios, direction deviations, etc). This is done by interpolating linearly between the available wind sector CFD results.
In ZephyCFD the resulting model is called a “Rose”.
Extrapolations
Each Rose generated in the previous step has a reference point, to which the user should associate a Climatology file. Then this wind data can be extrapolated by the Rose to the rest of the domain, giving the final wind estimations.
In addition to the available visualizations, these results can be exported:
- Climatology files for single points
- .wrg, .shp, .xyz… for wind maps
Yield Assessment
Once one or several wind extrapolations are available, it is possible to assess the expected annual yield for the project’s wind turbine layout, giving the final production estimations.
The user have to associate .wtg files to the project’s wind turbines. It is possible to either set a single power curve for the whole farm, or to differentiate the turbine groups, or even each turbine individually.
Several different results can be exported as tables, in particular the production estimations (P50, P75, P90…) along with the associated turbine-wise uncertainties.