ANALYSE Tab
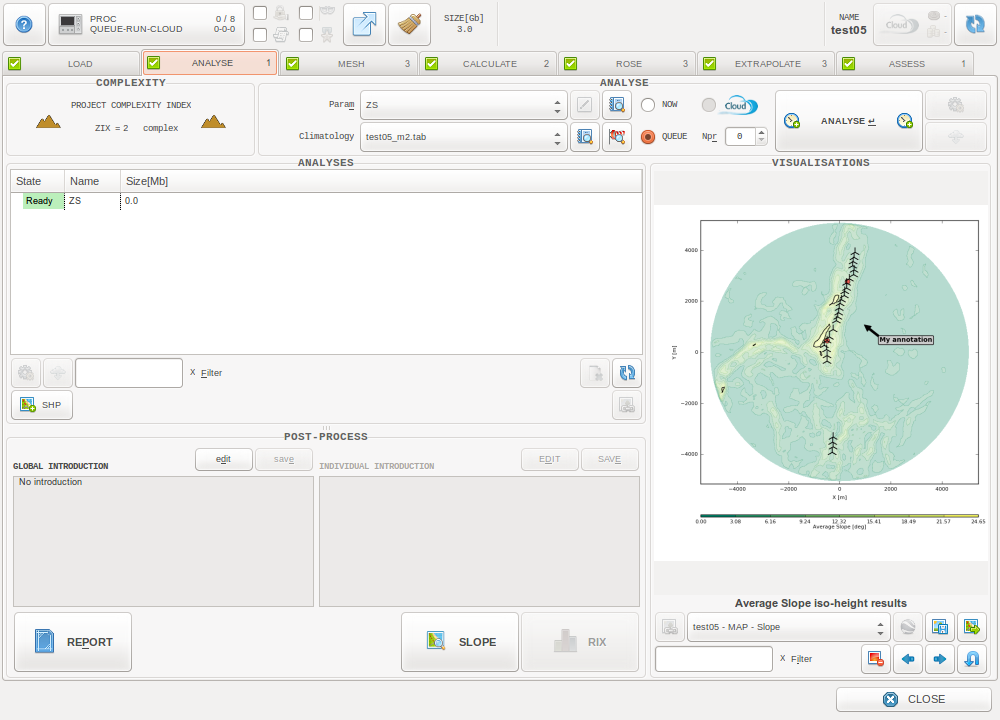
The ANALYSE Tab
The “Analysis process” deals with:
Result points terrain elevations
- For each mast location
- For each wind turbine location
- For each result point location
- For each point defining the mapping area grids
- For each point defining the results visualization grid
- For each point defining the surface associated with each of the mesoscale entities
Terrain complexity evaluation
- RIX evaluated for each mast location
- RIX evaluated for each wind turbine location
Slope map generation
- Over the result visualization grid
Note
These last two parts of the process are heavy, but are not mandatory.
These processes are not run when the “No RIX Analysis” set of parameters is selected.
The process duration is proportional to : The number of entites and related sub-entities, the amount of orography data, and the process parameters).
Process options

As soon a climatology file is associated with the project, it can be selected as input for the analysis process to be run.
The climatology here basically helps contour complex areas considering the effects of prevailing wind sectors. If the analyze is performed without a climatology file, the contour will be drawn using the standard RIX, which contains less site information.

Define the run type. For local types, define the number of processors to be used for the CFD simulations. Nproc 0 will automatically consider maximum available resource (=Total CPUs - 1).
Process parameters

The parameters defining the Analysis process are read from the selected set of parameters. User’s default set of parameters is automatically selected in the list.
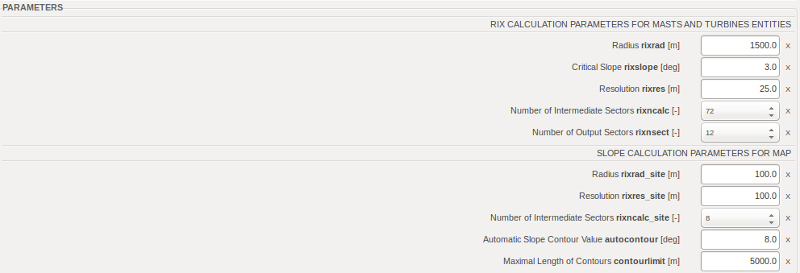
These parameters are only used when RIX calculations are activated.
RIX analysis is based on your project orography file, and provides results at each key locations and for each directional sector. The value, given in %, represents the part of the terrain around the wind turbine or met mast where the slope is higher than the critical slope.
The overall RIX value is the average of the sector-wise RIX values. For climato-based RIX, or WRIX, different weights are attributed to the sectors, with higher weights for prevailing directions.
Note
Huge project? Using “fastZS” configuration or even lighter settings is a better option than avoiding the process.
Visualizations
The ANALYSE Tab features Maps & Iso-Heights and Diagrams visualizations.
In this tab, the map visualization window features a specific module: The Slope Contour window.
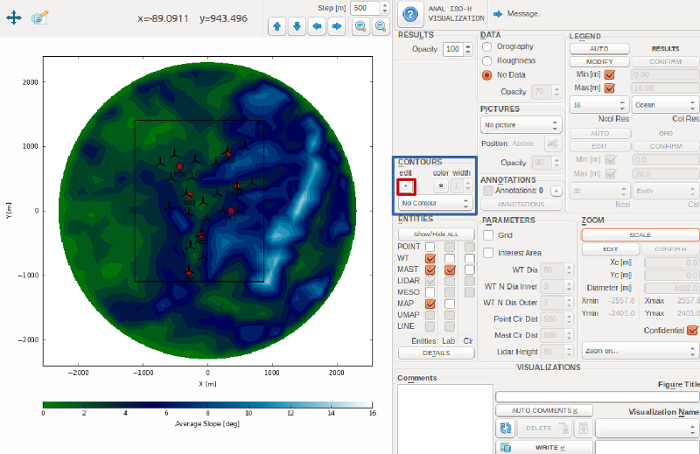
Use the “+” button from the “CONTOURS” frame to generate slope contours.These contours can then be used by the mesher to generate RIX-dependent meshes.
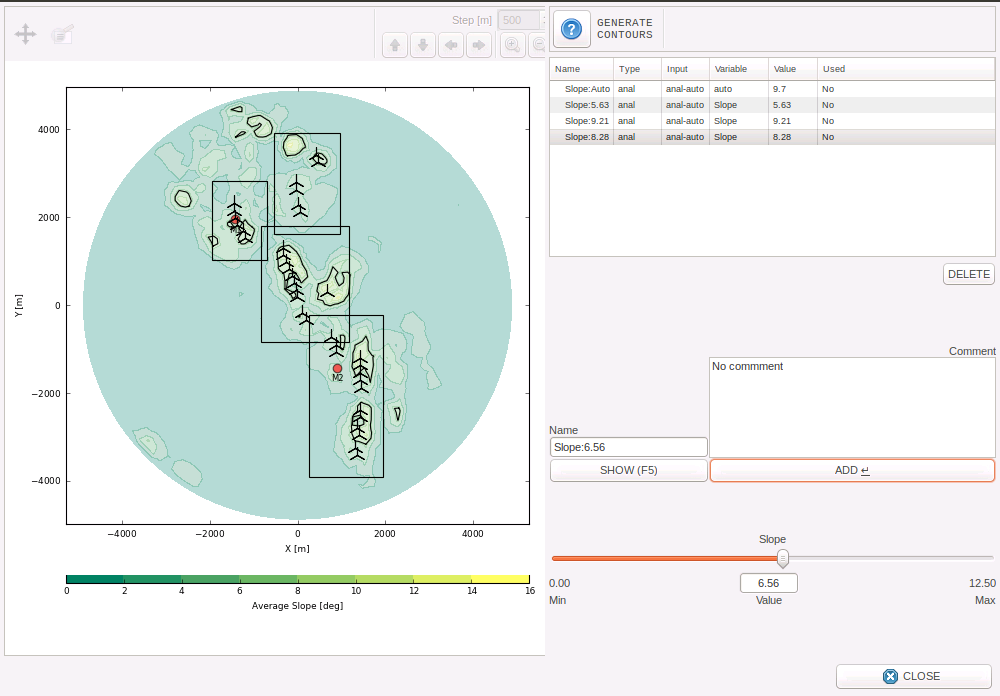
The Slope Contour definition window
- Drag the bar to select the slope criterion.
- Use the SHOW button to see the corresponding contour on the plot.
- Use the ADD button to save the contour.
Click on the RIX button to generate a bar graph showing the RIX and WRIX for each wind turbine and met mast.
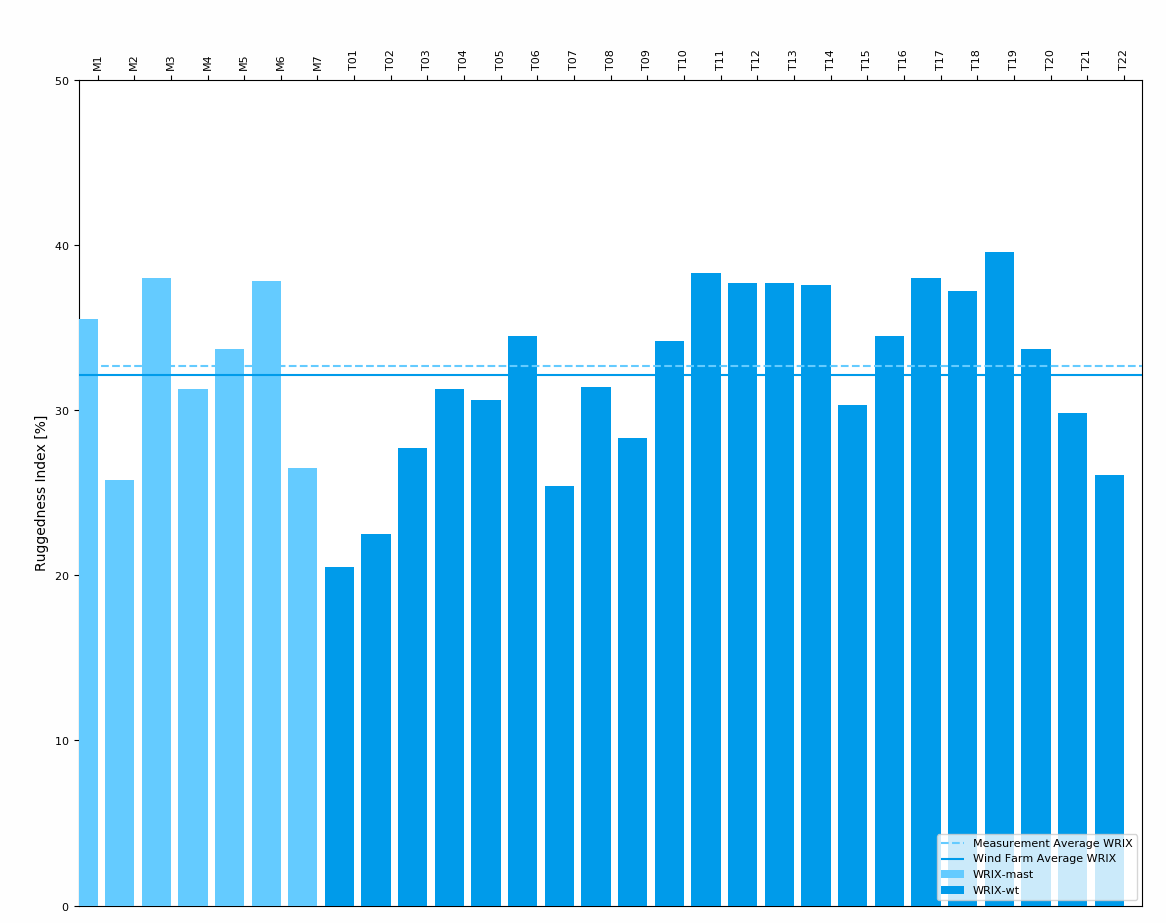
The RIX graph
Technical notes
ZIX
What is the ZIX indicator?
The ZIX is an in-house index for overral terrain complexity of the site. It is based on :
- Maximal elevation variation (
 )
) - Elevation standard deviation (
 )
) - Average slope (
 )
) - Maximal slope (
 )
)
These variables are ranked on a scale from 0 to 3, 3 being the highest range of values:
| Variable/Rank | 0 | 1 | 2 | 3 |
|---|---|---|---|---|
| [m] |
[0,400[ | [400,850[ | [850,1300[ | [1300,  [ [ |
| [m] |
[0,75[ | [75,175[ | [175,275[ | [275, [ |
| [°] |
[0,2[ | [2,5[ | [5,10[ | [10, [ |
| [°] |
[0,15[ | [15,21[ | [21,27[ | [27, [ |
The ZIX then equals to the highest rank found within these four values.
RIX
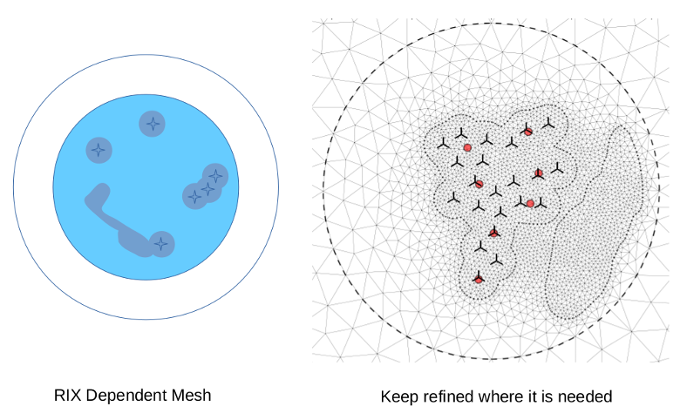
What is a RIX-dependent mesh and what is it used for?
The “RIX-dependent” mesh feature uses the defined slope contour as another input of refinement rather than refining only the interest area.
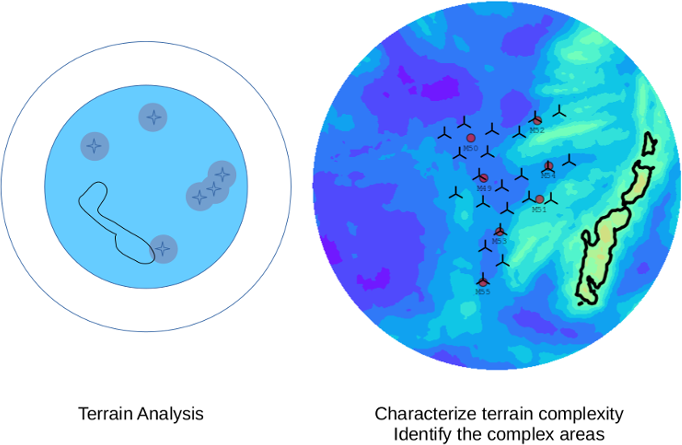
As long as the RIX analysis is activated, ZephyCFD will automatically generate a contour for extra interest area. With extra refinement on areas with more terrain complexity, the final result is more accurate.
Is ZephyCFD able to run roughness analysis in addition to the RIX analysis ?
Not yet, however the Climatology-based RIX analysis is considered more relevant in mesh building.