Visualizations
Information
Faithfully, this part of the document is far from complete.
Please be sure Zephy-Science makes its best for completing the user guide in brief delays.
Thanks for letting us know about any kind of correction needed…
ZephyTOOLS features many different types of visualizations and plots. For each of them the user can customize several parameters controlling the plot’s aspect. The default parameters for each kind of visualization can be set from the Visualizations Options window.
Note
In most of ZephyCFD tabs, it is possible to copy-paste visualization parameters! Check out Copy-Pasting
Common options
Edit/Write
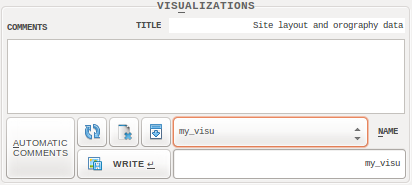
This frame is used to navigate the existing visualizations, edit their meta-data such as comments and title, and save them.

|
Save the current visualization under the given name. When no name is provided, an automatic one is used. |

|
Refresh all options to their initial state. If no visualization is selected, resets to Default options. |

|
Remove the current visualization. |

|
Push the current visualization to the end of the list of visualizations. This allows to control their order of appearance in reports and presentations. |
When writing comments, the command ///figure/// is available: It gets replaced in the reports by “Figure X: Title”.
Pan/Zoom
All visualizations have a navigation bar above them. It includes at least two of the standard matplotlib navigation tools:

|
Pan axes with left mouse, zoom with right. |

|
Zoom to rectangle. |
Annotations
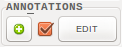
Allows to activate, deactivate and edit annotations on the plot.
Click on the “plus” button to define a new annotation, click on the “EDIT” button to manage existing annotations in the annotations window:

The Visualization Annotations window
- The LOCATION frame allows to set the annotation position precisely.
- The TEXT field defines the annotation content.
- To add multiple annotations on one same spot, modify the Annotation Number parameter of an existing annotation.
The default options can be set from the Visualization Default options window, in the “COMMON” tab.
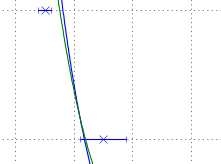
Vertical Profiles
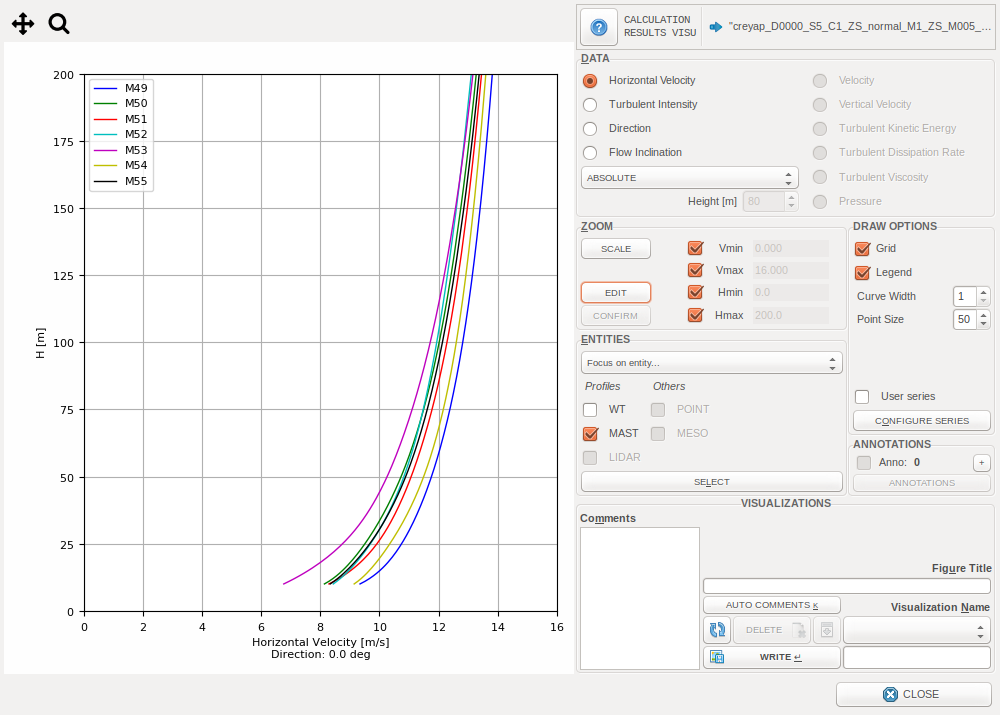
Vertical Wind Profile Visualization in ZephyCFD
User Series
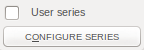
Click this button to access the User-Defined Series window and add user-defined data to the plot.
This is especially useful to compare measurement data with CFD results.
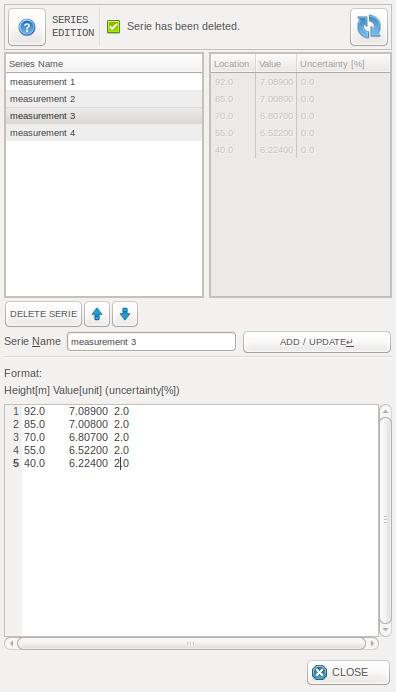
User-Defined Series window
For each point of a series ZephyCFD expects:
- Height [m]
- Point Value
- Uncertainty [%] to plot an uncertainty bar around the point
these values must be on a single line, separated by white spaces. Each line corresponds to a different point.
The series will be then shown on the plot.
Roses

Wind Rose Visualization in ZephyCFD
Maps & Iso-Heights
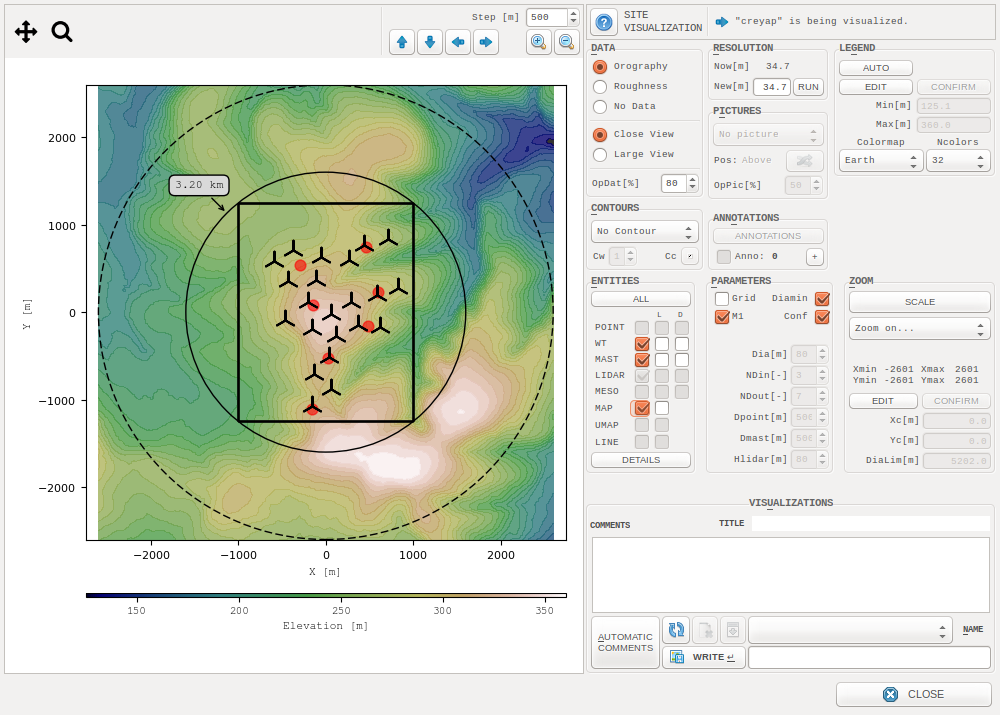
Site Visualization in ZephyCFD
Resolution
Use the “New” resolution feature to generate for more accurate visualizations. These resolutions will be also used when visualizing results… Keep descent resolutions as it affects the time for loading visualizations.
Diagrams
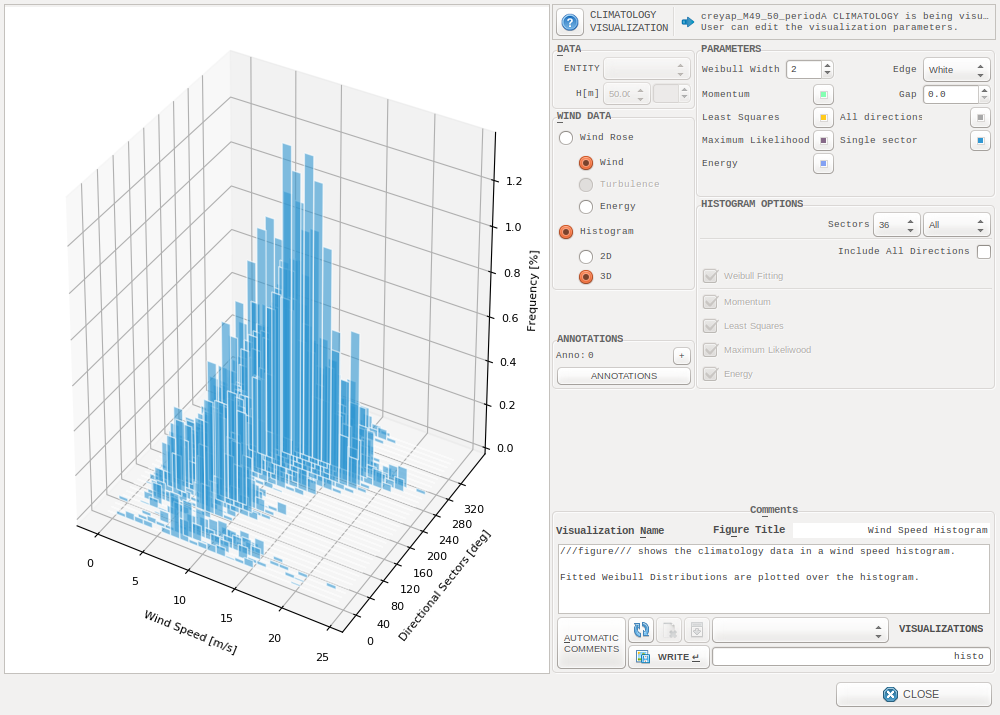
3D Histogram in ZephyCFD
Time Series
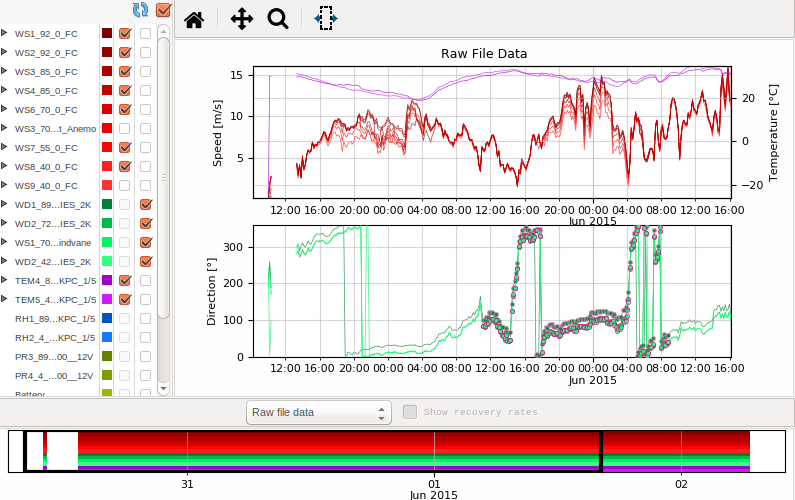
Time Series Visualization in ZephyWDP
Scatter Plots
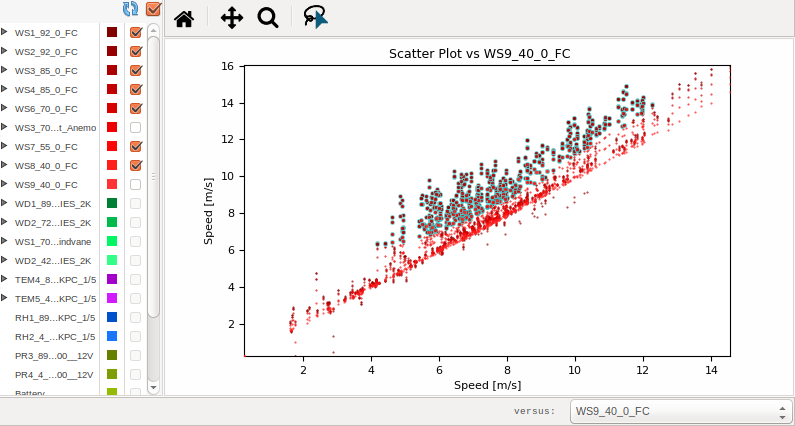
Scatter Plot in ZephyWDP
Copy-Pasting

This button allows to copy the parameters of the selected visualization. Alternately, the user can right-click the visualization and select “Copy Visualization”.
Once this is done, it is possible to generate new visualizations (for different items than the original one) which will directly use the copied parameters. This is especially useful if you have generated a visualization with a lot of customized content, and that you would like to get the same for many other items.
To do so, right-click the item for which you want a new visualization, and select “Write Copied Visualization”.
Note
Bulk copy-paste
In ZephyCFD CALCULATE Tab, it is possible to copy-paste several visualizations at once using ‘Copy Set of Visualizations’ and then ‘Write Set of Visualizations’
Note
Data copy-paste
For Wind Profiles & Roses, Data can be copied along with the parameters to other Visualizations using ‘Write Copied Visualization & Data’. The original plot data will then appear along with the new one, in dotted lines.
Default options
Exports
png

Click this button to export your visualization as a .png picture file. Alternately you can right-click the visualization -> “Export Picture”.
kmz

Click this button to export your visualization as a .kmz file, which you can open in Google-Earth. Alternately you can right-click the visualization -> “Export to Google-Earth”.
shp

In ZephyCFD ANALYSIS Tab, it is possible to export a shape corresponding to areas having slopes included in a certain range. Click this button to export a .shp ESRI shape file, which can be opened for example in QGIS software. This is especially useful for designing a Wind Farm Layout.
Data export
In ZephyCFD CALCULATE and EXTRAPOLATE Tabs, it is possible to export the plotted data of a certain visualization to a file. Right-click the visualization -> “Export Data”.
Note
For Vertical Wind Profiles this will export a table in a text file, whereas for Iso-Heights this will export a .xyz file.